High-Performance Java Data Systems

A comprehensive engineering note on latency, throughput, JVM behavior, JPA/Hibernate, JDBC, HikariCP, SQL, indexing, caching, Kafka, PostgreSQL, load testing, and capacity planning for high-performance Java data systems.
High-Performance Java Data Systems
High-performance Java data systems require database access, indexing, Java Persistence behavior, and data-intensive system design to be evaluated within one cost model. The goal is not to provide a list of knobs. The goal is to understand which layer becomes the limit under load, why it becomes the limit, and what every optimization costs in return.
The method does not change:
measure
find the bottleneck
change one variable
measure again under the same load
An optimization cannot be described only as "faster." An index improves reads while increasing write cost. Batching improves throughput while potentially increasing per-item latency. Caching reduces latency while adding consistency work. Replication improves availability or read capacity while creating staleness and failover semantics.
The Zen principle here is an engineering rule:
not more tuning
less work

not more concurrency
measured limits

not more abstraction
visible cost
If a change does not reduce work, make queues visible, or make a limit more deterministic, it may only be adding complexity.
Unit 1: Performance Model and Measurement
Performance analysis starts by defining the load under which latency, throughput, and resource use will be measured. Increase concurrency and locate the first saturated resource among CPU, connection pool, database, and network. Queue waiting time must be distinguished from service time. Tail latencies and failure rates may be more decisive for capacity planning than average response time.
Prerequisites and learning goals
Prerequisites
Working knowledge of Java, SQL, relational-database fundamentals, Spring/JPA, and basic operating-system concepts is assumed. The purpose is not API memorization; it is to explain where physical work is performed in a production data path and how to verify that work.
Learning objectives
After completing the note, the reader should be able to:
- model latency, throughput, saturation, and queues quantitatively,
- separate JVM, connection-pool, JDBC, ORM, and database time,
- evaluate transaction, MVCC, locking, and idempotency decisions without weakening correctness,
- validate execution-plan, index, batching, and pagination choices against product semantics,
- state the real boundaries of caching, Kafka, replication, and sharding,
- build reproducible performance hypotheses from JFR, profiles, OpenTelemetry traces and metrics, and load tests,
- size capacity from SLOs, tail latency, and failure headroom rather than peak headline numbers.
Reading map
The numbered sections are intentionally preserved so existing references and anchors remain stable. Pedagogically, they form six modules:
I    Performance model and measurement           §1-§4
II   Concurrency, transactions, persistence       §5-§14
III  Query path, SQL, plans, and indexes          §15-§26
IV   Data architecture, caching, streams          §27-§39
V    JVM, serialization, and runtime              §40-§42
VI   Testing, capacity, and decision discipline   §43-§49
1. Performance model
Latency and throughput
Latency is the time required to complete one request. Throughput is the amount of completed work per unit time. A system can achieve higher throughput while making an individual request slower.
Little's Law describes average concurrency in a stable system:
L = λ · W

L : work present in the system
λ : arrival rate
W : average time in the system
The same relation applies to HTTP requests, connection pools, queues, workers, and database sessions.
Example:
1000 requests/s
DB connection lease time per request = 5 ms

L = 1000 × 0.005 = 5
The theoretical average is five concurrent database connections, with additional headroom for variance. A thousand concurrent HTTP requests therefore do not imply a thousand database connections.
Saturation and queues
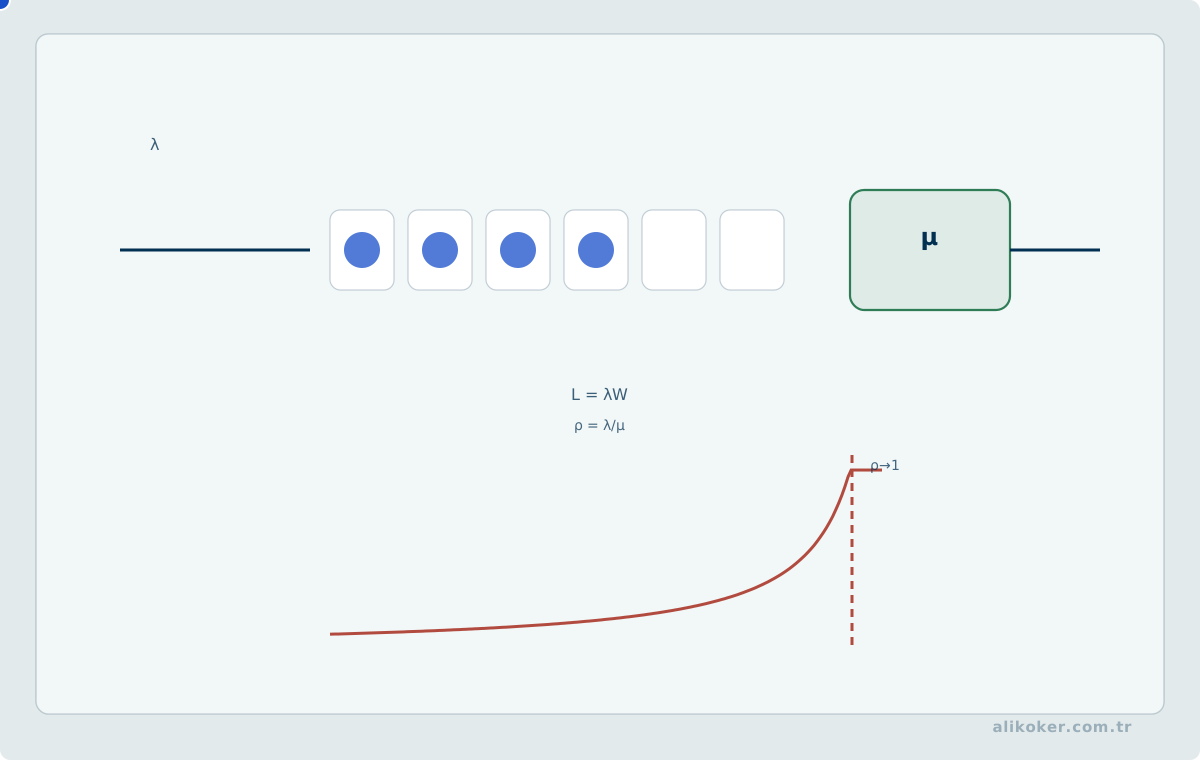
The M/M/1 model illustrates the queueing effect for one server in steady state under Poisson arrivals and exponentially distributed service times:
R = S / (1 - ρ)

R : mean response time including waiting
S : mean service time
ρ : utilization, 0 <= ρ < 1
This is not a universal formula for real OLTP systems. When arrivals or service times are more variable, the same utilization can create materially more waiting. In heavy traffic, Kingman's G/G/1 approximation makes that variability explicit:
Wq ≈ (ρ / (1 - ρ)) · ((Ca² + Cs²) / 2) · S

Ca : coefficient of variation of inter-arrival time
Cs : coefficient of variation of service time
As Ca² or Cs² grows, waiting grows even when mean service time does not. Measure service-time distributions and burstiness rather than treating utilization alone as the workload model. M/M/1 is a teaching model and Kingman is an approximation; production conclusions must be verified against the measured distribution (Kingman, 1961; Gunther, 2007).
As a resource approaches saturation, latency does not rise linearly. Moving from 50% to 95% utilization is not a small increase; queue behavior changes qualitatively.
Production capacity is selected below the cliff, with failure and burst headroom. A resource operated at its saturation point has no reserve for traffic spikes, GC, plan changes, storage stalls, or slow downstream calls.
Amdahl and coordination cost
Amdahl's Law limits total speedup by the serial fraction:
S(N) = 1 / ((1-p) + p/N)Distributed systems add coordination. The Universal Scalability Law models serialization and coherence/coordination cost:
C(N) = N / (1 + α(N-1) + βN(N-1))

α : serialization
β : coordination / coherence
When β is not zero, adding nodes can eventually reduce total throughput. Adding application instances that all contend on the same database rows, latches, or pages may only add competing clients.
Tail latency
Average latency hides bad queue behavior. P95, P99, and P99.9 are more representative of production tails.
When one request fans out to several dependencies, one slow dependency can dominate the entire request. As fan-out grows, tail events are observed more frequently by users.
Percentiles cannot be averaged. Per-instance P99 values must not be averaged to obtain a fleet P99. Histograms or raw distributions must be merged and the percentile recalculated from the combined distribution.
Coordinated omission
If a load generator waits for one response before sending the next request, the generator itself slows down when the system slows down. Requests that would have queued in real traffic are never sent, and P99 looks better than reality.
Where the workload represents an external arrival rate, the test should preserve an open-loop arrival process and measure latency from the scheduled arrival time.
2. Reliability, scalability, and maintainability
For a data-intensive system, I evaluate performance together with reliability, scalability and maintainability. Three questions belong in the same discussion:
- Does the service continue when a component fails?
- Does behavior remain predictable as traffic and data grow?
- Can the system be understood and changed safely?
A component failure is not necessarily a service failure. If a disk fails and replication masks it within the SLO, the component failed but the service did not.
Scalability does not mean merely "more machines can be added." The load dimension must be defined, the resource whose cost grows with that dimension must be identified, and the architecture must show how that cost is distributed.
Maintainability is not the opposite of performance. An opaque trick that no one can safely change six months later is not a sustainable optimization.
3. See the complete data-access path
A request does not reach a database in one step:
HTTP request
-> application thread
-> transaction boundary
-> connection pool
-> JDBC driver
-> network
-> SQL parse / plan
-> locks and MVCC
-> buffer cache
-> index / table / storage
-> result set
-> ORM mapping
-> serialization
-> network response
Every arrow is a separate cost boundary. A single repository call can represent dozens of SQL statements, thousands of rows, many network round trips, or long lock waits.
Optimization starts by selecting the right layer. If SQL execution takes 2 ms but connection acquisition takes 150 ms, query tuning is aimed at the wrong layer. If the query takes 400 ms, adding threads simply runs the expensive query more concurrently.
4. Measurement discipline
Four measurement layers and distributed traces
First observe the same cost across four physical layers:
application       request, transaction, query count
JVM               CPU, allocation, GC, thread waiting
database          plan, rows, blocks, locks, redo/WAL
operating system  CPU, memory, disk, network
One layer alone rarely establishes causality. Distributed tracing is better viewed as a correlation plane across these resource layers rather than a fifth physical resource layer: it connects one request across service, database, and messaging boundaries.
Do not turn trace IDs into metric labels; that creates unbounded cardinality. Where the telemetry backend supports exemplars, link selected histogram observations to representative traces. Metrics answer "where and how much," traces answer "which request path," and profiles answer "which code path produced the cost."
Application metrics
Request rate, errors, and latency distributions describe service health. Utilization, saturation, and errors describe resource health.
High-cardinality labels destroy metric systems. User IDs, request IDs, raw URLs, SQL text, and free-form error strings should not become metric labels.
At minimum, a connection pool should expose:
active connections
idle connections
pending requests
acquisition time
timeouts
JFR and profiling
Java Flight Recorder provides a low-overhead timeline of CPU, allocation, GC, locking, parking, I/O, and virtual-thread events. A continuously rotating recording is often more valuable than a profiler attached only after the incident.
A CPU profile shows code that is executing. If a service is slow while CPU is low, inspect wall-clock time: locks, network, pools, parking, and other waits appear there.
Inspect allocation before increasing heap size. GC tuning without identifying unnecessary allocation usually hides the cost rather than removing it.
SQL observation
Three independent views are required:
- the SQL and parameters actually sent by the application,
- ORM query/entity/flush counts,
- the database's real execution plan and actual row counts.
show_sql can help during development but does not explain duration, batching, bind behavior, or the total number of calls. Query-count assertions can catch the N+1 query problem during tests instead of in production.
Separate work from elapsed time
Elapsed time changes with cache warmth, concurrent load, and storage state. Blocks read, rows returned, bytes transferred, and round trips are more stable descriptions of work.
Every optimization should answer:
what did we do less of?If there is no answer, the gain is often temporary or accidental.
Micrometer, histograms, and cardinality
A Spring Boot timer is not sufficient by itself. Micrometer represents counters, gauges, timers, and distributions in a common model. For backends such as Prometheus, aggregable latency is represented through histogram buckets.
Client-side P95 or P99 values calculated per meter ID cannot be aggregated correctly across instances or tag sets. Histogram buckets can be summed only when bucket boundaries and measurement semantics are compatible. A percentile reconstructed from those buckets is still an estimate bounded by bucket resolution rather than an exact order statistic from raw observations.
Histograms also have a cost. Every bucket and every tag combination creates time series. SLO boundaries and expected ranges should be bounded to the workload rather than enabled indiscriminately.
RED and USE complement each other:
RED: rate, errors, duration
USE: utilization, saturation, errors
If P99 rises while CPU remains low, inspect pool, disk, network, and lock saturation. If CPU rises while request rate is constant, inspect allocation, serialization, plan changes, and newly hot code paths.
async-profiler and flame graphs
JFR provides JVM-wide context and event chronology; async-profiler is strong for low-overhead CPU, allocation, wall-clock, and lock sampling. They are complementary.
A CPU flame graph shows execution. A wall-clock profile includes waiting. An allocation flame graph answers which call paths create objects before GC becomes the visible symptom.
Flame-graph width represents sample or time share; the visually highest frame is not automatically the problem. Find the wide base, follow the stack, and profile again after the change. Differential profiles help explain where the win actually came from.
Continuous recording and native memory
Production-only incidents are easier to diagnose when telemetry existed before the failure. JFR can be run continuously with a bounded recording and dumped when an event occurs.
Not every diagnostic tool belongs in always-on mode. Native Memory Tracking is disabled by default and has measurable overhead. It tracks HotSpot/JVM-native categories but not all third-party native allocations. If RSS grows while heap does not, distinguish:
heap
metaspace
thread stacks
direct buffers
JVM native structures
JNI / third-party native memory
Commonly Confused Java Concurrency and Performance Guarantees
A dangerous Java-performance mistake is inferring guarantees from API names. ConcurrentHashMap, volatile, streams, virtual threads, and connection pools are useful in the right context, but each solves a bounded problem.
What does volatile guarantee?
volatile provides Java Memory Model visibility and ordering guarantees around accesses to that variable. It does not make a compound read-modify-write such as count++ atomic. Counters or other compound updates may require AtomicLong, LongAdder, a lock, or another coordination mechanism.
What does ConcurrentHashMap guarantee?
The map is designed for concurrent access, but it cannot make an arbitrary sequence of separate calls atomic. A get() followed by put() has an interleaving point. Operations such as compute, computeIfAbsent, merge, and putIfAbsent can provide the required compound semantics when appropriate, although mapping-function cost and side effects still need control.
Stream API is not a parallelism guarantee
A stream expresses data-processing operations declaratively. parallelStream() does not automatically improve performance. Input size, partitioning overhead, function cost, shared state, other work in the common ForkJoinPool, and cache locality determine the result. For small collections, parallel overhead can exceed the useful work.
Virtual threads do not multiply downstream capacity
Virtual threads can reduce the cost of blocked platform threads for highly concurrent blocking I/O. They do not create more database connections, remote-service QPS, storage bandwidth, or CPU cores. Concurrency must still be bounded around the scarce downstream resource.
Connection pools and request concurrency interact
If request concurrency is much larger than the JDBC pool, additional threads mostly wait for a connection. Making the connection pool arbitrarily large can instead increase database sessions, lock/latch contention, and I/O pressure. Sizing follows database capacity and transaction duration, not application thread count alone.
JPA does not remove SQL cost
A single repository or entity-level line can trigger multiple SQL statements through lazy relationships, dirty checking, or cascades. N+1 behavior is measured in actual SQL and result cardinality, not source-line count. Fetch joins and projections also have trade-offs such as row multiplication and pagination behavior.
The role of prepared statements
Parameterized statements are primarily a correctness and security boundary that separates SQL structure from values and reduces injection risk. Performance effects depend on the driver and database plan/cache model. “PreparedStatement is always faster” is not a universal rule.
Reducing GC is not the same as managing memory well
Reducing allocation can lower GC pressure on hot paths, but trying to eliminate every allocation can damage clarity and even optimization opportunities. Modern JVMs handle many short-lived objects efficiently. Measure allocation profiles and GC behavior first; introduce pooling, reuse, or escape-oriented changes only when evidence justifies them.
Evidence chain for performance changes
A robust sequence is:
workload → SLO → measurement → bottleneck → hypothesis → controlled change → re-measurement
Calling an API “fast” does not replace this evidence chain.
Distinguishing queueing delay from concurrency. In a stable flow, suppose completed throughput is λ = 120 requests/s and mean time in the defined system is W = 0.25 s. Little's law gives L = λW = 30 mean concurrent in-system requests. If throughput increases to 240 requests/s while mean time becomes 0.5 s, then L = 120: twice the throughput corresponds to four times the mean work in progress in this example. W includes waiting and processing within the chosen system boundary, not merely CPU or SQL execution. L is not automatically a database connection-pool size; concurrency at each stage must be measured separately. Nor can p95 or p99 latency be derived from Little's law. Capacity analysis begins with boundaries, steady state, and measurement interval, then considers the latency distribution, queue growth, and bottleneck together.
Unit 2: Connections, Concurrency, and Transaction Boundaries
A connection pool must not be sized by equating application tasks with database connections. Measure database execution capacity, transaction duration, and pool wait queues. Enlarging the pool may merely increase contention when backend capacity is fixed. Monitor queue delay, timeouts, and database CPU together to determine where excessive concurrency starts reducing overall throughput.
5. Connection pools
Connections are expensive
Creating a new database connection can involve TCP establishment, authentication, database-session creation, and memory allocation. A pool amortizes that cost over the application lifetime.
A pool does not make a database connection itself faster. It reuses expensive sessions and, more importantly, bounds how much concurrent work may enter the database.
Bigger is not necessarily better
Database parallelism is bounded by CPU, storage, locks, and shared internal structures. If the pool exceeds that useful parallelism, the queue moves from the application into the database.
A small bounded pool creates visible waiting and controlled timeouts. An oversized pool can create more simultaneous SQL, more lock and I/O contention, and worse tail latency.
Sizing
Core-count formulas are starting hypotheses, not laws. A better starting point is measured connection lease time combined with Little's Law.
Load-test several pool sizes and find the region that sustains the target throughput with the lowest stable P99. The answer is usually a safe interval, not a magical integer.
Timeouts and lifetime
Connection acquisition must be bounded. Infinite waiting only hides overload inside request queues.
Maximum connection lifetime can be set below database or infrastructure time limits so the application retires connections before the network does. Keepalive should be used only where the infrastructure requires it and should remain below maximum lifetime.
Prefer JDBC driver validation such as Connection.isValid() when supported instead of issuing a heavy validation query. Leak detection is a diagnostic for unexpectedly long leases, not a permanent performance optimization.
Acquire late, release early
Do not hold a database connection across file I/O, long computation, or remote service calls unless the consistency model truly requires it.
bad:
  begin transaction
  read DB
  call remote service
  compute
  write DB
  commit

prefer:
  read required data in a short transaction
  compute/call outside the transaction
  write in a short transaction
If atomicity cannot span those steps, the solution is usually a different process design rather than a longer connection lease.
Multiple application instances
Total sessions grow approximately as:
application instances × pool size per instanceTen instances with pools of twenty can create two hundred database sessions. Capacity must be calculated at the database level, not one service instance at a time.
A transaction pooler can reduce server sessions but loses or virtualizes session state. Temporary tables, session variables, session locks, and prepared-statement semantics must be reviewed.
Read HikariCP settings by purpose
Important settings are not interchangeable:
maximumPoolSize    upper bound on DB concurrency
connectionTimeout  waiting budget when saturated
maxLifetime        connection retirement age
keepaliveTime      liveness interval for idle connections
validationTimeout  validation budget
maximumPoolSize is not derived from application thread count. HikariCP's own sizing guidance emphasizes that fewer connections often outperform more connections once the database is saturated.
When no connection is available, getConnection() should fail within a bounded budget. Hiding pool saturation behind more retries or threads increases pressure.
Pool behavior is best diagnosed by reading pending requests, acquisition P99, and database service time together. If acquisition time rises while DB service time remains stable, the pool/application queue is the limiting boundary. If DB service time rises as well, widening the pool often worsens contention.
Active connection count alone is insufficient to diagnose pool saturation. Pending acquisitions, the distribution of acquisition wait times, database service times, and timeout counts should be examined over the same interval. If the pool filled because queries became slower, enlarging it may increase concurrent SQL pressure and worsen the bottleneck. Distinguish slow plans, lock waits, storage delays, and acquisition contention before changing the pool size, then validate the adjustment with a controlled workload.
6. Virtual threads and the real concurrency limit
Virtual threads make thread-per-request code cheaper during blocking I/O because a blocked virtual thread can release its carrier. They do not accelerate CPU-bound work.
Therefore:
10,000 virtual threads
10 DB connections
still yield roughly ten concurrent database operations. Removing the platform-thread bottleneck often exposes the connection pool as the next limit.
The response is not to expand the pool automatically. Bound arrival rate, shorten transactions, measure acquisition time, and keep database concurrency inside the safe region.
Spring Boot 4 and version boundaries
As of August 2026, Spring Boot 4 does not enable virtual threads by default; spring.threads.virtual.enabled=true enables them. With virtual threads enabled, many traditional executor-pool sizing properties no longer have the same effect because scheduling is handled by the JVM-wide carrier scheduler.
Virtual threads are daemon threads. Applications whose lifetime depends only on scheduled tasks may need to consider Spring Boot's keep-alive behavior explicitly.
JDK 21 finalized virtual threads. JDK 24 delivered JEP 491, allowing virtual threads blocked in many synchronized constructs to release their carrier threads, removing a major historical source of pinning. This does not justify assuming that pinning or carrier starvation can never occur; native calls and library-specific behavior must still be verified with JFR.
@Async, schedulers, and uncontrolled fan-out
@Async is not capacity. It is another execution queue. Schedulers do not create downstream capacity either. Virtual threads can make fan-out cheap enough to overwhelm the next resource faster.
The effective limit is the smallest safe downstream boundary:
10,000 cheap virtual threads
-> 10 DB connections
-> 4 downstream-service permits
-> 1 hot lock
Structured Concurrency
Structured Concurrency treats related subtasks as one lifecycle for cancellation, failure propagation, and observability. As of JDK 26 it remains a preview API. Code that adopts it must acknowledge preview-version compatibility instead of treating the API as a stable cross-release contract.
WebFlux solves a different problem
WebFlux is useful when the full path is non-blocking and Reactive Streams backpressure, streaming, or high fan-out are real requirements. Spring MVC with virtual threads keeps a blocking programming model while reducing the cost of waiting.
Wrapping blocking JDBC/JPA in a reactive chain does not make the database non-blocking. R2DBC is a separate driver and transaction model. Choose from the blocking behavior of the whole path, not from framework fashion.
7. Transaction boundaries
The physical meaning of ACID
Atomicity is implemented with undo/rollback mechanisms, durability with redo/WAL, and isolation with locking or MVCC. Consistency results from constraints plus correct application logic.
A commit is not simply the end of a Java method. If durability is required, the relevant log records must reach durable storage. Group commit amortizes the fsync cost across multiple transactions and can materially increase throughput.
MVCC
MVCC lets readers observe a consistent older version so readers and writers interfere less. The cost is version retention and cleanup.
Long transactions can extend not only lock lifetime but also the lifetime of old versions. A "read-only transaction cannot hurt" rule is therefore false in general.
Isolation anomalies
Important anomalies include dirty read, dirty write, non-repeatable read, phantom read, read skew, lost update, and write skew.
Snapshot isolation resolves many read anomalies but does not inherently prevent write skew. Two transactions can update different rows based on the same cross-row invariant and violate the invariant together.
Serializable execution guarantees an outcome equivalent to some serial order. The implementation may pay with lock waiting or by aborting/retrying conflicts.
Isolation names are not guarantees
READ COMMITTED, REPEATABLE READ, and SERIALIZABLE differ in detail across database products. Portable code should test the business invariant on the target database rather than trusting the annotation name alone.
Keep transactions short
Do not include user interaction, large file transfers, long computation, or avoidable remote calls inside a database transaction.
Short transactions release connections sooner, reduce lock lifetime, reduce MVCC pressure, shrink optimistic-conflict windows, and reduce the amount of work repeated after failure.
8. Spring transaction management
@Transactional is proxy/interceptor behavior, not syntax magic. A direct self-invocation that bypasses the proxy may not create the intended transaction boundary.
Default rollback behavior depends on exception type. If the business rule requires rollback for a particular failure class, encode the policy explicitly rather than relying on accidental defaults.
REQUIRES_NEW can require a second physical connection. If outer transactions occupy every pool connection while inner transactions wait for new ones, the application can deadlock itself at the pool.
readOnly=true is not an enforcing write barrier or a database permission. Spring can propagate a read-only hint to JDBC, while Hibernate can use read-only entity semantics to avoid some snapshots/dirty checking and reduce flush work. A driver may ignore or interpret the hint differently. The effective behavior is provider-, driver-, and version-dependent; it is not a substitute for database security or integrity constraints.
Read-replica routing must also handle replica lag and read-your-writes semantics.
9. Concurrency control
Optimistic locking
A version column is added to the update predicate:
UPDATE account
SET balance = ?, version = version + 1
WHERE id = ? AND version = ?;
Zero affected rows mean the state changed. There is no lock wait, so optimistic locking is cheap when conflicts are rare.
It protects the versioned entity, not every cross-row business invariant. Aggregate versioning, unique constraints, serializable transactions, or explicit locks may still be required.
Pessimistic locking
A pessimistic lock creates a queue on the resource. Under very high contention with short critical sections it can be cheaper than a retry storm.
Rules:
acquire late
keep work short
lock resources in a consistent order
bound waiting
never call remote services while holding the lock
Deadlocks
A deadlock is an expected failure mode of a locking system, not evidence that the database is broken. The database detects the cycle and aborts a victim.
The application should classify the transient error, retry the whole transaction rather than the last statement, cap attempts, and use exponential backoff with jitter.
Idempotent retry
Running the same business command twice must not create two external effects. Payment, messages, files, or remote calls should not be repeated blindly with a database transaction retry.
An idempotency key maps the same business command to the first recorded result so a duplicate attempt observes the existing outcome.
10. Transactional outbox and external effects
A database transaction and a message broker or HTTP endpoint normally cannot be made atomic by one local transaction.
Transactional outbox:
same DB transaction:
  write business state
  write outbox record

separate process:
  read outbox
  publish message
  mark delivery state
Messages may still arrive at least once, so consumers must be idempotent. An exactly-once guarantee is meaningful only inside a defined transaction boundary. Kafka can provide exactly-once processing within its own transactional boundary, but an external database, HTTP call, file system, or other side effect does not automatically join that boundary. Crossing such boundaries still requires an outbox, idempotency keys, deduplication, or another explicit protocol.
Admission control and bulkheads: thread count is not capacity
Modern Java can represent a very large number of blocking tasks cheaply, but this does not expand the capacity of the scarce resource behind those tasks. Database connections, remote-service concurrency, file descriptors, CPU time, and storage queues remain independent limits. The execution model and the amount of admitted concurrent work therefore need separate designs.
request
  |
  v
classification
  |
  v
admission gate ---- full ----> fast rejection / timeout / retry
  |
  v
scarce resource
(DB, remote service, disk, CPU)
A permit mechanism such as Semaphore can establish an explicit concurrency budget in front of an expensive boundary. This is not the same as creating another thread pool. Virtual threads can make waiting tasks cheaper; a semaphore limits how many tasks may enter the scarce resource at the same time. The mechanisms solve different problems.
A bulkhead also need not place every request into one shared budget. Work classes with different cost or importance can be isolated so that an expensive low-priority path cannot consume all capacity needed by short critical work. The classes should be derived from measured cost, trust level, and service contracts rather than arbitrary endpoint grouping.
When the boundary is full, an unbounded queue is usually the least predictable response. As the queue grows, start latency rises and the system keeps carrying historical load instead of recovering. Controlled rejection, bounded waiting, and an appropriate retry policy often produce a more stable failure mode. This should be read together with Virtual Threads Do Not Increase Database Capacity and the general concept of rate limiting.
Useful measurements include permit-wait time, rejection rate, time spent queued, downstream utilization, and P95/P99 latency. Effective admission control keeps overload inside a defined capacity envelope instead of allowing latency to grow without bound.
Estimating cost before expensive I/O
Admission control is not limited to the number of concurrently executing threads. If request cost can be estimated from already available metadata, unnecessary I/O can be rejected or narrowed before it begins.
Useful dimensions include:
- candidate-record count,
- number of sources that are not yet loaded,
- expected batch and request count,
- estimated aggregate text or payload size,
- whether a CPU-heavy operator is safe to run on the current execution path.
When a request exceeds the allowed envelope, silently sampling a smaller subset is often the wrong response. The caller should narrow the scope, or the operation should be refused explicitly. Silent sampling turns a performance optimization into a correctness defect when the result is presented as if the full scope had been examined.
Layered budgets are stronger than a single maximum request size. Batch size, request count, aggregate bytes or characters, and CPU cost consume different resources and can therefore require independent bounds.
Database transaction scope follows the same discipline. Authorization, relational reads, and consistency checks can finish inside a short transaction; large file, text, or CPU work can continue after the connection is released. A useful design target is:
T_transaction ≪ T_requestKeeping long transformations outside the database transaction reduces connection-pool occupancy, lock lifetime, and MVCC pressure.
Related Courses and Technical Studies
Queues, Backpressure, and Tail Latency in Java Services
Queue growth in a Java service represents a sustained gap between admitted requests and work completed by downstream systems. Increasing virtual-thread count does not remove database connection-pool or remote-service concurrency limits. Admission limits, bounded queues, and timeout policies should be evaluated alongside p95/p99 latency and rejection rates. Before choosing a backpressure mechanism, identify which component holds the queued work and how cancellation propagates.
- Bound concurrency by downstream capacity rather than increasing thread or virtual-thread counts without limit.
- Treat connection pools, executors, and database service time as one queueing chain.
- Measure the saturation point where mean RPS rises while p99 latency and timeout rate deteriorate.
Unit 3: Persistence Context, ORM, and Data Transfer Cost
11. Persistence context
The persistence context represents one database identity as one managed Java object, accumulates state changes, and performs dirty checking.
Convenience has a cost:
managed entities ↑
snapshot memory ↑
flush scanning ↑
GC pressure ↑
Do not let a long batch job grow the persistence context without bound.
Flush and clear
for (int i = 0; i < items.size(); i++) {
    entityManager.persist(items.get(i));

    if ((i + 1) % batchSize == 0) {
        entityManager.flush();
        entityManager.clear();
    }
}
flush() synchronizes pending SQL, clear() detaches managed entities, and commit makes the transaction durable. They are different operations.
Read-only paths
For read-only output, DTO or scalar projection is often cheaper than loading managed entities. If entities are required, read-only transaction/provider hints can reduce unnecessary snapshot and flush work.
persist versus merge
Use persist for a new entity. merge copies detached state into a managed instance and can trigger hidden reads. In bulk write paths, detached-entity workflows therefore need careful measurement.
Explicit DTO boundaries also reduce accidental lazy loading across layers.
Stateless paths
For very large write streams where first-level caching, cascades, and dirty checking are not required, a stateless Hibernate session or direct JDBC can be more appropriate. Less magic means more explicit responsibility.
12. Open Session in View
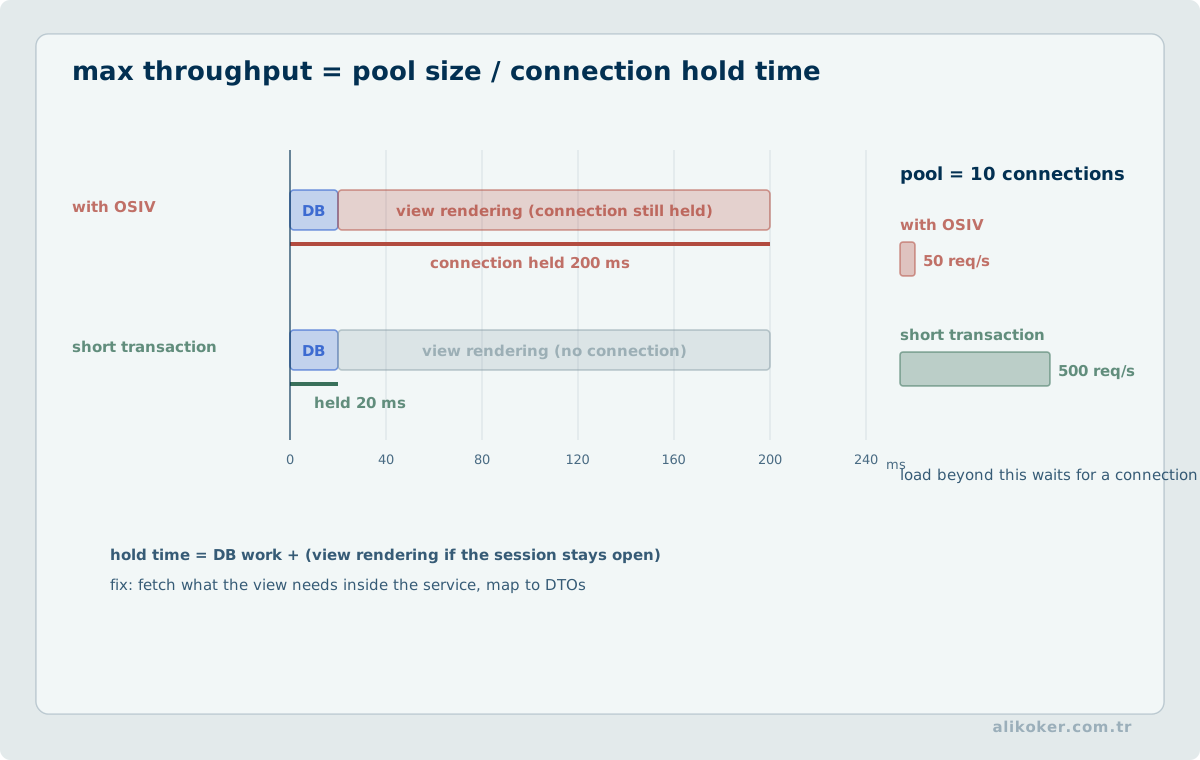
With Open Session in View, the web layer can continue reaching into the persistence context. That convenience can hide transaction boundaries, issue lazy SQL during JSON serialization, conceal N+1 from service tests, and keep database resources alive longer than expected.
Prefer:
service transaction
-> fetch exactly what is needed
-> build DTO
-> close transaction
-> web layer never touches DB state
Setting open-in-view=false does not create lazy-loading bugs; it reveals data access that was previously hidden.
13. Identifier strategies
What a primary key is for
A primary key is more than a lookup accelerator. It defines row identity and underpins ORM identity maps, association resolution, and update semantics.
If a separate business uniqueness rule exists, enforce it with a unique constraint. An application-side "check then insert" can race under concurrency.
IDENTITY
With IDENTITY, the identifier is generally known only after the insert. This makes it harder for Hibernate to delay and group inserts, so it is often a poor fit for heavy batched writes.
SEQUENCE
A sequence can provide the identifier before the insert. Pooled and pooled-lo optimizers reduce one-database-call-per-ID overhead.
Larger sequence caches can create gaps. A technical primary key is an identity mechanism, not an accounting sequence. Gapless business numbering is a separate requirement.
UUID
UUID-like identifiers can be generated independently across nodes. Fully random identifiers can reduce B-tree insertion locality; time-ordered UUID variants can improve locality.
Think in terms of:
single DB authority          sequence
distributed independent IDs UUID-like
business meaningful key     natural key + separate technical PK
14. Mapping cost
Types
Java and database types must represent the same semantics. Mixing timezone-aware and timezone-free temporal types creates correctness problems and can also introduce conversion cost or prevent effective index use.
Storing enums by ordinal makes existing data dependent on source-code declaration order. Stable string/code values are safer.
Large fields
Do not move LOB, JSON, or large text through every list endpoint. Hot queries should select only required columns, and large content can use a separate access path.
A LAZY declaration on a large field is not evidence that the provider actually avoids fetching it. Verify generated SQL and bytecode-enhancement requirements.
Inheritance
ORM inheritance transfers object-model convenience into query cost. Single-table inheritance generally minimizes joins but creates sparse columns. Joined inheritance normalizes the model but polymorphic reads can require several joins. Table-per-class can turn polymorphic reads into unions.
Use inheritance in the persistent model only when its domain benefit exceeds the query and schema cost.
15. Associations and N+1
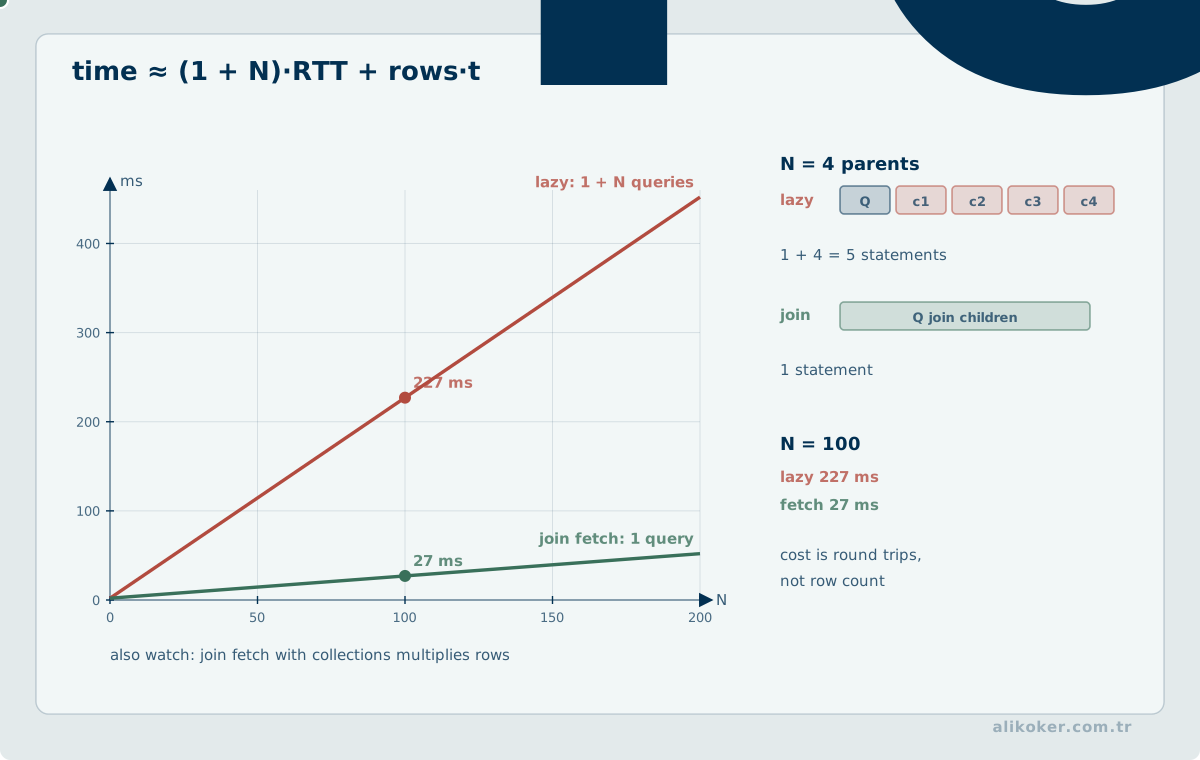
N+1 is not "one query is slow." It is a query-count problem:
1 query for parents
+ N queries for children
A low-latency database can still perform poorly when hundreds of round trips are introduced.
EAGER is not a universal fix. It can eagerly load data that a request did not need and can still produce many SQL statements depending on the mapping and query.
Options include DTO projections, explicit join fetches, entity graphs, batch fetching, and subselect-style fetching. The correct choice depends on result cardinality and whether the association is required for that use case.
Join fetch and Cartesian multiplication
Fetching several to-many collections in one SQL can multiply rows. Ten parents with ten children in two collections can produce hundreds or thousands of physical rows even if the logical object graph is small.
The database, network, and ORM must process every physical row. One large query is therefore not automatically cheaper than a small bounded number of queries.
Pagination with collection fetch
Collection join fetch and pagination are a dangerous combination. Some ORM paths may fetch a much larger result and apply root-entity limits in memory.
A safer design is often:
query page of root IDs
-> fetch required graph for those IDs
For read-only screens, DTO projection can avoid the entity graph entirely.
16. Result sets and transferred data
Project only required columns
SELECT * is not neutral. It increases database block-to-row work, network bytes, JDBC decoding, Java allocation, and serialization.
DTO projections make the read contract explicit and can avoid persistence-context tracking.
Fetch size
JDBC fetch size controls how rows are transferred from the driver/database, not how many rows the query logically returns. It can reduce round trips on large result sets, but behavior is driver- and database-specific.
For example, Oracle's historical small default row-prefetch behavior can make an explicit fetch size important for medium/large result sets, while other drivers may already stream or buffer differently. Measure on the exact driver and database version.
Streaming
Streaming avoids materializing a large result all at once, but it also keeps database resources open while the stream is consumed. Slow downstream processing can therefore hold a connection for a long time.
For long exports, bounded pages or database-native bulk/export mechanisms can be safer than a single hour-long transaction-backed stream.
17. Pagination
Offset pagination
ORDER BY created_at, id
OFFSET 100000
LIMIT 50
Large offsets can force the database to identify and discard many rows before returning the page. Cost grows with page depth.
Keyset pagination
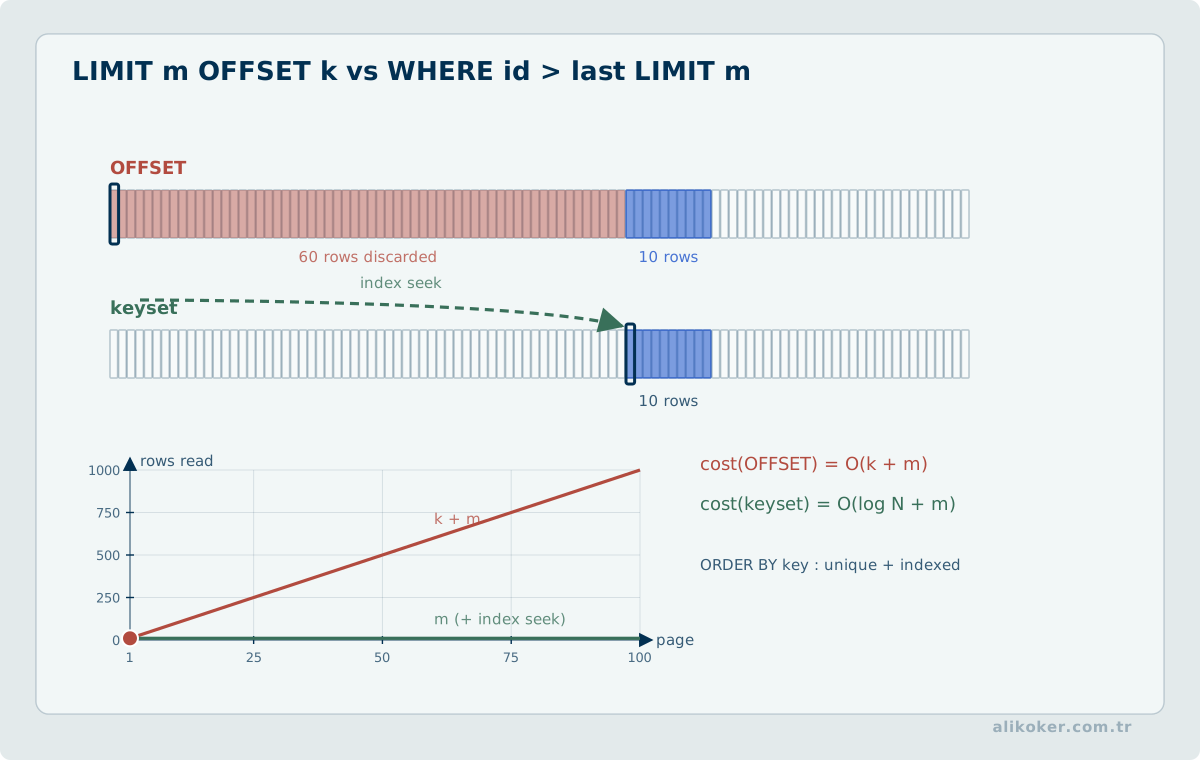
Keyset pagination continues from the last unique ordering key. Products such as PostgreSQL and MySQL can express the lexicographic predicate compactly with a row-value comparison:
WHERE (created_at, id) > (?, ?)
ORDER BY created_at, id
For cross-product portability, expand the same ordering explicitly:
WHERE created_at > ?
   OR (created_at = ? AND id > ?)
ORDER BY created_at, id
Choose LIMIT, FETCH FIRST, or the equivalent row-limiting syntax separately for the target database. Support and optimizer behavior for row-value inequalities differ by product/version, so verify the actual plan and composite-index access path.
This avoids the work of locating and discarding a deep offset and is efficient for scrolling APIs, feeds, and batch traversal, although arbitrary direct jumps to page 5000 become less natural.
The ordering must be unique. A timestamp alone can produce duplicates or gaps when several rows have the same value; append a unique key.
COUNT cost
A full COUNT(*) is not required on every page. If the client needs only "is there a next page?", fetch one extra row or use slice semantics.
Compute an exact total only when it is a business requirement, not because a framework page abstraction happens to expose it.
18. Batch writes
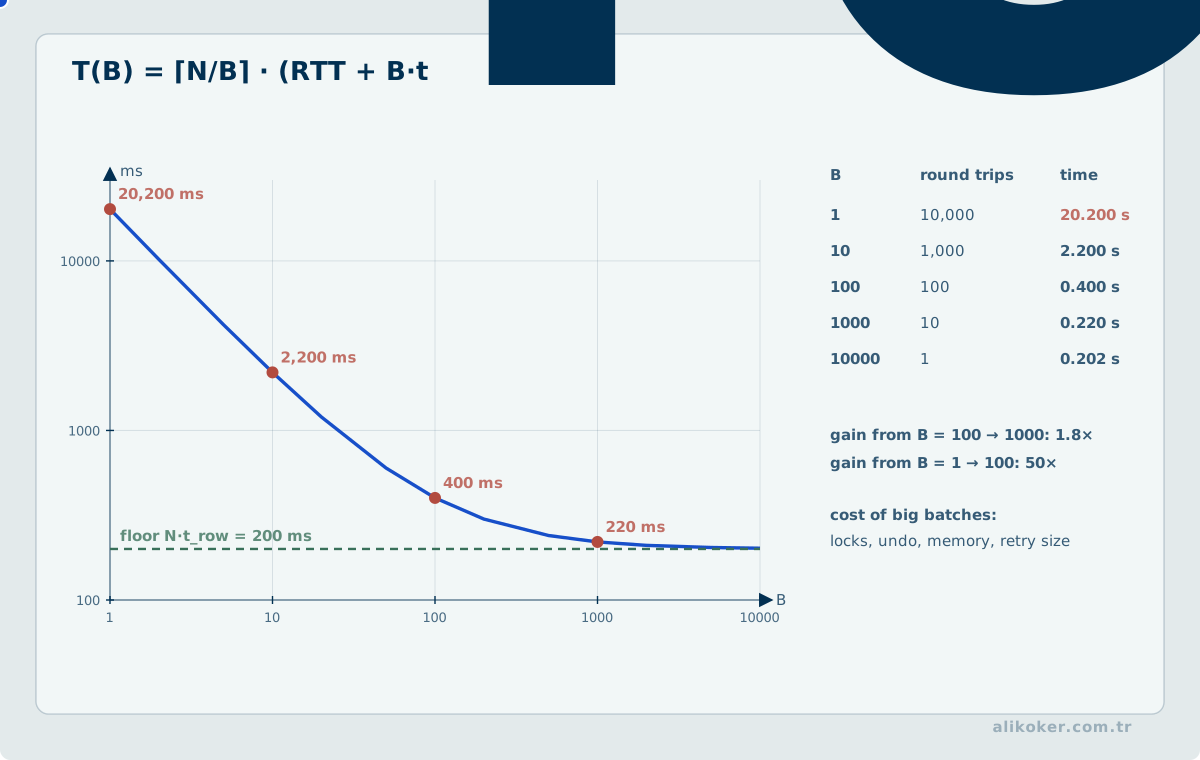
Batching primarily wins by reducing network and protocol round trips, not by making a single insert cheaper to execute.
10,000 inserts
one by one   -> ~10,000 sends
batch of 100 -> ~100 groups
The exact packet and execution behavior depends on the driver and database protocol.
As batch size grows, round trips decrease but client/server buffers grow, rollback scope grows, and per-record waiting time can increase. Values such as 50 or 100 are experiment starting points, not constants.
Hibernate batching
Statements with the same SQL shape need to occur close together so batches can fill. Ordering inserts or updates can help.
Identifier strategy matters. IDENTITY can prevent effective insert batching because the generated key is needed after each insert. Sequences with pooled allocation work better for batch-heavy paths.
Bulk DML
One set-based statement can be dramatically cheaper than loading thousands of entities and mutating them one at a time:
UPDATE job
SET state = 'EXPIRED'
WHERE state = 'OPEN'
  AND expires_at < ?;
Bulk DML bypasses persistence-context state. Clear or refresh affected managed entities afterward to avoid stale in-memory state.
19. Set-based SQL versus row-by-row processing
Relational databases are designed for set operations. A row-by-row loop in application code or stored procedural code increases round trips, context switches, and lock duration when one set-based SQL statement could express the same transformation.
The problem is not "using a cursor" as a concept; database engines already use cursor-like execution internally. The problem is converting a set problem into a row algorithm without need.
Prefer:
single set-based statement
-> bulk/batch
-> controlled row processing only when unavoidable
On shared clusters such as RAC, unnecessary row-by-row access can also increase cross-instance block coordination.
Measuring ORM Work Amplification: Fetch Plans, Persistence Context, and Transaction Boundaries
In an ORM-based system, source-code size has no direct relationship with the amount of physical work performed. One repository call may execute one SQL statement, generate many SQL statements, or materialize a large result set into an entity graph.
JPA/Hibernate performance should therefore first be described in terms of physical work rather than API names.
A simplified request-cost model is:
T_request
≈
T_pool_wait
+
Σ(
    T_network_round_trip
    + T_database
    + T_mapping
)
+
T_serialization
This is not a performance law. It is a diagnostic model showing which costs should be separated during measurement.
N+1 is work amplification before it is a code smell
When one parent query is followed by one relationship query per returned item, query count grows approximately as:
Q(N) = 1 + NIf the parent query returns 1000 records, the path may therefore execute roughly 1001 SQL operations.
The problem is more than that the query count looks aesthetically high. Each additional call can repeat some part of JDBC invocation, network round trip, database scheduling, parse/bind/execute, result transfer, and mapping.
Nested relationships can amplify work further:
parent records       = N
children per parent  = M

work
≈ 1 + N + N×M
Actual SQL count depends on the fetch strategy and cache state. The expression is intended to make the growth pattern visible.
Reducing query count is not sufficient evidence of optimization
Replacing N+1 with a single SQL statement is not automatically an improvement.
Fetching several to-many relationships together can multiply result rows:
100 orders
× 20 lines
× 5 tags
=
10 000 result rows
The application may ultimately expose only 100 orders while JDBC has transferred a much larger intermediate result.
The lowest query count and the lowest total amount of work are therefore different objectives.
Useful dimensions include SQL invocation count, result rows, bytes transferred, logical I/O, database CPU, connection lease time, entity count, allocation, serialized payload size, and tail latency.
Fetch strategy should follow the use case
There is no universal JPA/Hibernate fetch strategy.
Projection
When a screen or report needs only a few fields, a projection can avoid materializing a complete entity graph.
Projection is especially effective for read-oriented paths. Recreating update-oriented domain behavior inside DTOs, however, can introduce a different form of complexity.
Fetch join
A fetch join can retrieve a required relationship in the same SQL statement and reduce round trips.
The cost is a wider result set and potential row multiplication for collections. Collection fetching and pagination should therefore be validated against the SQL actually generated and the resulting cardinality.
Entity graph
An entity graph can express a use-case-specific fetch plan without changing the global mapping policy for every caller.
It still does not eliminate result cardinality or query-plan cost. Generated SQL must be measured.
Batch fetching
Grouping relationship keys into fewer queries can reduce N+1 amplification for appropriate access patterns.
The useful batch size depends on data volume, bind limits, execution-plan behavior, network latency, and memory cost.
The persistence context is also a working set
A Hibernate persistence context is not only a first-level lookup cache. It is a unit-of-work structure that tracks managed entity state.
When a long-running operation loads many entities, live managed state on the heap and state tracked for dirty checking can grow materially.
Large batch operations should therefore consider persistence-context size in addition to JDBC batch size.
Where application semantics permit, controlled processing windows may use:
process
flush
clear
next group
flush() is not a commit. Sending pending state to the database and making a transaction durable are different operations. clear() is also not a generic optimization because state still needed by the current unit of work can be detached.
The batch boundary must remain compatible with required atomicity.
Rollback does not rewind the Java object graph
A database rollback can undo persistent database changes. It does not automatically restore every Java object in memory to its state at transaction start.
After a serious persistence failure, continuing normal processing with the same failed persistence context is therefore not a reliable recovery model.
A safer mental model is:
transaction fails
        ↓
rollback
        ↓
failed unit of work ends
        ↓
new work uses a clean persistence context
Recovery is more than catching an exception. It requires defining which state remains trustworthy after failure.
A transaction boundary is larger than the annotation location
Spring commonly applies @Transactional behavior through proxy-based advice. Seeing the annotation in source does not prove that every invocation path crosses the same transaction boundary.
In particular, direct self-invocation inside the same target object can bypass the proxy path.
The size of the transaction also matters for performance:
begin transaction
read DB
wait for remote HTTP service
perform file I/O
perform long CPU work
write DB
commit
Such a flow can extend the transaction lifecycle through time in which the database provides no useful work.
Shorter transactions are not an automatic solution either. If the business invariant requires one atomic unit, splitting it only to improve a timing metric can destroy correctness.
The decision order should remain:
atomicity requirement first
transaction boundary second
physical resource cost third
Define regression budgets for ORM behavior
ORM regressions do not need to be discovered only in production. Critical read paths can be given observable budgets during tests or production-like load tests.
Possible dimensions include expected maximum SQL count, expected result-row range, connection acquisition P95/P99, database service-time P95/P99, connection lease duration, materialized entity count, allocated bytes, and response payload size.
Not every metric belongs in every unit test. A few stable budgets around high-volume paths or previously regressed behavior can nevertheless form a strong guardrail.
Measuring only database execution time is insufficient:
2 ms SQL
+ 80 ms pool wait
+ 30 ms mapping
+ 20 ms serialization
≠
2 ms request
Likewise, an unchanged query count does not prove unchanged physical work.
A practical decision sequence for ORM optimization
A useful investigation sequence is:
1. What data does the request actually require?
2. How many SQL statements execute?
3. How many rows and bytes does each statement return?
4. What is the actual database plan and I/O?
5. How long does the connection pool wait?
6. How large does the persistence context become?
7. What are mapping and allocation costs?
8. Is the transaction wider than required?
9. Does the optimization preserve correctness semantics?
10. Is the result reproducible under the same production-like load?
This approach does not attempt to remove ORM from the architecture. It keeps the relationship between the ORM abstraction and physical data access visible.
Abstraction improves development productivity. Performance engineering makes the work hidden under that abstraction measurable again.
Unit 4: SQL, Execution Plans, Indexes, and Storage
20. SQL preparation and plan reuse
Parse, bind, planning, caching, and execution semantics differ by database. Oracle terms such as "hard parse" and "plan-cache fragmentation" should therefore not be presented as universal database mechanisms.
Bind parameters
WHERE user_id = ?separates values from SQL text, is a primary defense against SQL injection, and creates a stable statement shape for reuse. Its planning effect still depends on the database and JDBC driver.
Oracle: cursor reuse and hard parse
Oracle's shared SQL area and cursor reuse make parse behavior an important OLTP cost. Embedding literals can turn one logical query into many distinct SQL texts, increasing parse/cursor work and shared-pool pressure. For short OLTP statements, hard-parse cost can approach execution cost.
Bind variables do not imply that one plan is optimal for every value. With skewed data, inspect histograms, bind peeking, adaptive cursor sharing, and actual cardinalities on the target Oracle version.
PostgreSQL: prepared statements, custom plans, generic plans
Do not assume an Oracle-style plan cache shared across PostgreSQL sessions. A SQL PREPARE object is session-scoped. With plan_cache_mode=auto, PostgreSQL executes the first five parameterized executions with custom plans, computes their average estimated cost, then compares a generic plan against that average to decide whether repeated replanning remains worthwhile. force_custom_plan and force_generic_plan can be useful diagnostic controls (PostgreSQL 18, PREPARE).
The PostgreSQL question is therefore parse/planning cost, statement lifetime, custom-versus-generic selection, and connection/session lifetime—not generic "global plan-cache fragmentation."
JDBC driver layer
Calling PreparedStatement in application code is not identical to reusing the same server-side prepared statement or execution plan.
Oracle JDBC implicit statement caching can reuse prepared/callable statement objects per physical connection. Each physical pooled connection owns its own statement cache, so pool size and SQL-shape diversity affect reuse.
pgJDBC can switch a repeated PreparedStatement to a named server-side prepared statement after prepareThreshold=5 by default. Its per-connection prepared-statement cache defaults to 256 queries with a 5 MiB size limit. These are driver-version defaults, not recommended tuning constants.
application PreparedStatement
-> JDBC cache / prepare threshold
-> physical connection lifetime
-> database prepared/cursor semantics
must be considered as one path.
Data skew
The same plan is not optimal for every bind value. One value may return one row while another returns half the table. Inspect estimates versus actual rows, statistics, and the target database's bind-sensitive or custom/generic planning behavior before concluding that binds themselves are the problem.
IN lists
Variable-length IN lists can create many statement shapes. ORM parameter padding can reduce shape diversity in some workloads but is not a universal switch. For large sets, evaluate temporary tables, array/table parameters, or other set-based mechanisms supported by the target database.
Transaction poolers and prepared statements
With PgBouncer or another server-session pooler, an application connection and a PostgreSQL server session are no longer the same thing.
- session pooling releases the server connection after the client disconnects,
- transaction pooling releases it after each transaction,
- statement pooling releases it after each statement and therefore cannot support multi-statement transactions.
Modern PgBouncer can track protocol-level named prepared statements in transaction/statement modes when configured with max_prepared_statements. That does not make all session semantics portable. Session SET state, advisory locks, temporary-table behavior, and SQL PREPARE require explicit review.
The Zen rule is simple: if the application does not need session state, do not create session state.
21. Execution plans
A plan is the tree of operations the database selected. The first question is not "did it use an index?" but:
estimated rows
versus
actual rows
If the optimizer expects 100 rows and receives 10 million, join algorithms, memory sizing, and access paths can all be wrong.
Access paths
A sequential/full scan can be correct for a small table or a low-selectivity predicate.
An index scan can be excellent when few rows qualify, but if many rows qualify the resulting random table lookups can be more expensive than a scan.
An index-only path can avoid table lookups when all required data and visibility conditions permit it.
Join algorithms
Nested loop is strong when the outer input is small and the inner side has an efficient lookup.
Hash join is strong for larger equality joins but can spill when the hash state exceeds memory.
Merge join is efficient for already ordered inputs but may pay an explicit sort cost otherwise.
Read block/page access, spills, loop counts, and row flow, not just total time.
EXPLAIN versus real execution
EXPLAIN describes the optimizer's estimate. EXPLAIN ANALYZE actually executes the statement and reports observed rows/timing. This distinction is critical for DML with side effects.
PostgreSQL BUFFERS and equivalent vendor-specific execution statistics help answer:
what did the optimizer expect?
what actually happened?
how many blocks/pages moved?
did an operator spill?
how many times did the node execute?
Plan cost units are not milliseconds and should not be compared across database products as if they were wall-clock measurements.
22. Indexing
An index is more than a performance add-on; it is a physical expression of an access pattern. Primary and unique constraints are first about correctness.
Primary and unique constraints
A primary key defines row identity. A unique constraint atomically enforces a business key even under concurrent requests.
SELECT whether row exists
then INSERT
is race-prone unless the database also enforces uniqueness.
B-tree
B-tree is the general-purpose default for equality, range, ordering, and prefix access. The theoretical search depth is logarithmic, but real performance depends on fan-out, cache residency, row lookup cost, and selectivity.
Composite indexes
A multicolumn B-tree is usually most effective when leading columns are constrained. A useful heuristic is:
equality columns
-> first range column
-> ordering / covering columns
This is not an absolute rule that a later column can never drive index access. PostgreSQL 18 added B-tree skip scan, which can generate repeated internal searches and use later-column constraints when the planner expects that to read less of the index. It is most attractive when the unconstrained leading columns have relatively few distinct values; with many distinct values another access path can still win. Validate the heuristic against the actual plan and data distribution (PostgreSQL 18, §11.3).
Covering indexes
If all required columns are in the index, the database may avoid returning to the table. Reads decrease, but the index becomes larger and writes become more expensive.
Partial/filter indexes
Indexing only a hot subset such as WHERE active = true can make the access structure much smaller. Syntax and capability are database-specific.
Expression indexes
A predicate such as LOWER(code) = ? may require an expression/function-based index matching the expression.
Foreign keys
Foreign-key columns are common join paths and are relevant to parent update/delete behavior. Missing indexes can create broad scans and lock effects depending on the database.
Index cost
Every index must be maintained on insert, delete, and updates to indexed columns. It adds redo/WAL, storage, buffer-cache use, and maintenance work.
Therefore both "no indexes" and "index every column" are wrong. Measure unused and overlapping indexes.
Full scans are not automatically wrong
For low-selectivity predicates, the cost of reading the index and then repeatedly locating table rows can exceed a sequential scan. Ask which path performs the least work, not why an index was ignored.
Hash, GIN, and BRIN
B-tree is not the only useful index family.
A hash index is specialized for equality and does not provide range ordering. It is not automatically superior to B-tree for routine equality lookups.
GIN behaves as an inverted index and is useful when one row contains many searchable keys, such as PostgreSQL arrays, full-text terms, and supported jsonb operators. The read benefit comes with heavier write/maintenance cost.
BRIN stores summaries over physical block ranges rather than one entry per row. It can be extremely small and effective for very large tables whose physical order correlates strongly with time or increasing identifiers. Poor correlation reduces its pruning value.
Choose an index family from the operators and access pattern, not from the column type alone.
PostgreSQL memory and maintenance
shared_buffers, work_mem, and effective_cache_size represent different concepts. PostgreSQL documentation's 25% shared_buffers figure is a starting point for a dedicated server, not a universal formula.
work_mem can be consumed by several sort/hash operators in one query, by many concurrent sessions, and by parallel workers. Total memory can therefore be many times the configured value.
Autovacuum is more than deletion cleanup. It recovers dead tuples, maintains planner statistics and visibility information, and can directly affect the ability to use index-only scans. Disabling it to improve a short benchmark can damage steady-state performance.
pg_stat_statements is useful for ranking SQL families by aggregate system cost rather than staring only at the single slowest query.
Read replicas can be selected using an application signal such as a read-only transaction, but lag and read-your-writes semantics must be solved explicitly.
23. SSDs, storage, and write amplification
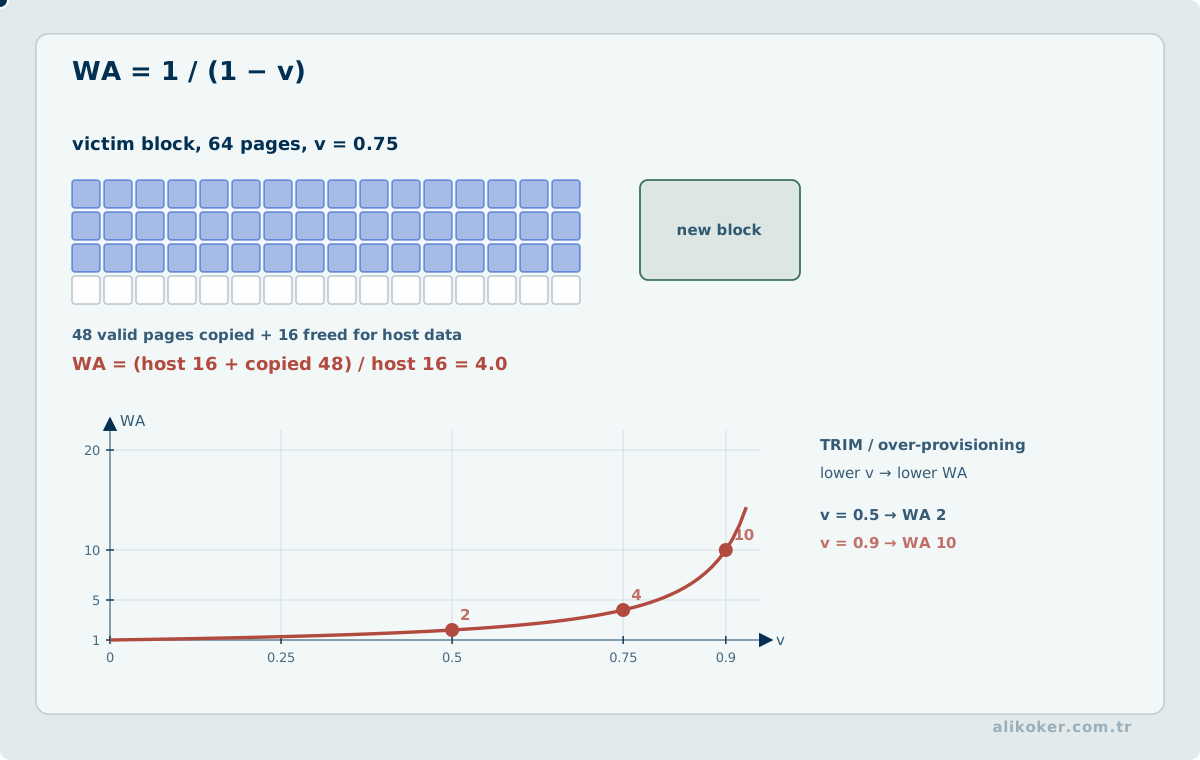
The main cost of an unindexed query is unnecessary reads, CPU, buffer pressure, and concurrent-resource consumption. SSD endurance is more directly driven by bytes written and write amplification.
write amplification = physical bytes written / logical application bytes writtenB-tree writes can involve WAL plus data/index page writes. LSM writes may traverse WAL, memtable flush, and compaction. Both can turn one logical change into several physical writes.
Random writes can create more internal flash-management work than sequential patterns. Short benchmarks can overstate LSM write throughput if compaction has not reached steady state. Run long enough to include maintenance work.
24. B-tree and LSM
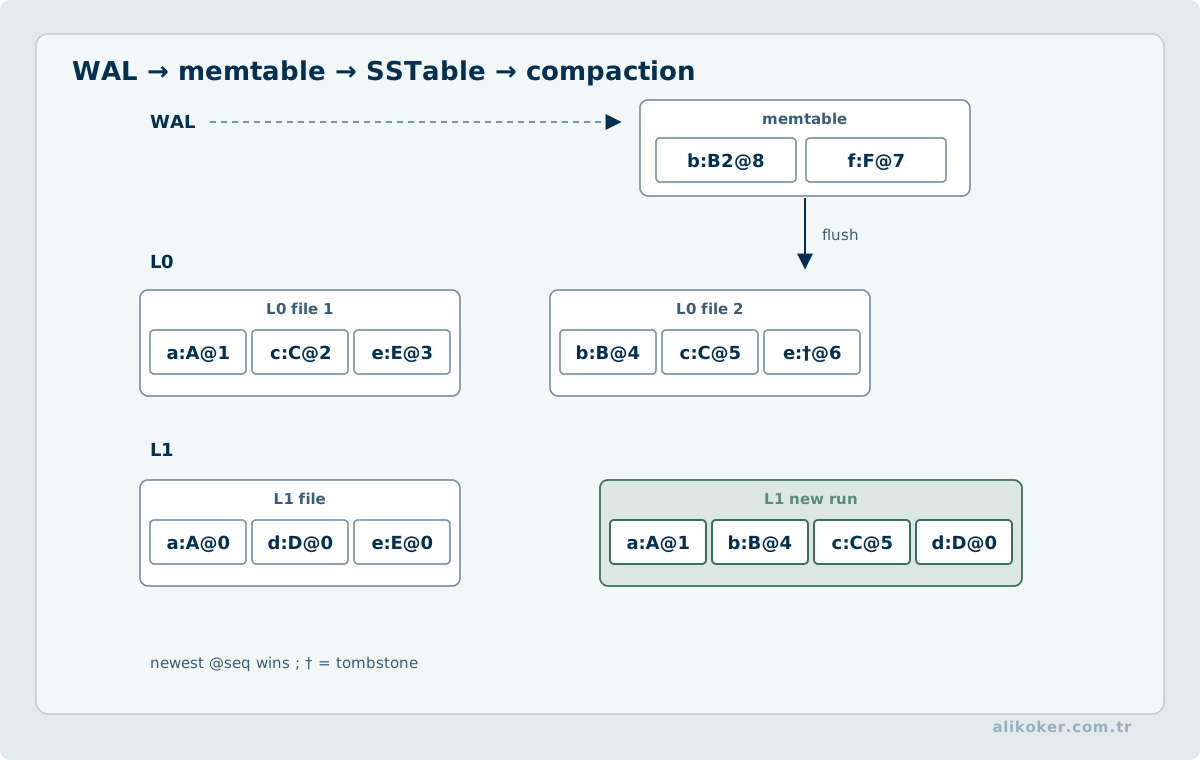
A B-tree updates pages in place and provides predictable point/range lookup through a bounded tree depth.
An LSM design typically follows:
WAL
-> memtable
-> immutable SSTables
-> compaction
It converts much of the write path into sequential work. Reads may consult several SSTables; Bloom filters help avoid unnecessary reads for absent keys.
General tendency:
B-tree  lower point/range read latency
LSM     higher sustained write throughput
The actual result depends on dataset size, overwrite rate, key distribution, compaction policy, cache, and storage.
Compaction is not free background work. If incoming writes exceed compaction capacity, a healthy engine must eventually apply backpressure.
25. OLTP and OLAP
Operational systems create and update current state. Analytical systems scan and aggregate large datasets.
OLTP                         OLAP
--------------------------   ---------------------------
short transactions           long scans / aggregation
few rows                     many rows
frequent writes              mostly reads
row-oriented                 column-oriented
indexed point access         scans, compression, vectorization
low latency                  high aggregate throughput
The same physical system can support both, but if analytical work damages transaction latency the workloads should be separated.
Row and column storage
Row storage keeps fields of one record close and is efficient for transactional record access. An analytical query reading three columns out of a hundred wastes bandwidth if it must read all hundred.
Column storage reads only selected columns, compresses similar values effectively, and can use SIMD/vectorized execution across large blocks.
Materialized views
A repeated expensive query can be precomputed. This moves work from read time to refresh/write time.
A materialized view is derived state, not the system of record. It is safer when it can be rebuilt from authoritative data.
Move analytics away from OLTP
Prefer:
OLTP
-> CDC / ETL
-> analytical system
rather than repeatedly scanning the transaction database. Columnar systems such as ClickHouse are not generic drop-in replacements for Oracle or PostgreSQL OLTP; they solve a different workload.
Unit 5: Data Architecture, Replication, and Distributed Data
26. System of record and derived data
The system of record holds the authoritative copy of a fact. A cache, search index, materialized view, warehouse, or machine-learning model is derived state.
authoritative state
-> transformation
-> derived view
Failure handling becomes simpler when derived data can be reconstructed from the source.
This distinction also clarifies caching: losing a non-authoritative cache is a performance event, not data loss.
27. Replication
Why replicate
Replication can serve three different goals:
- fault tolerance,
- read capacity,
- geographic proximity.
One mechanism does not satisfy all three at the same consistency and latency cost.
Physical and logical replication
Physical replication transfers low-level WAL/storage changes. It is close to the storage engine and efficient, but can impose stronger version/engine coupling.
Logical replication transfers row-level changes and is better suited for CDC or heterogeneous consumers.
A missing stable key can make logical updates/deletes more expensive because more old-row state may be required to identify what changed.
Synchronous and asynchronous replication
Synchronous replication adds durability but also latency and failure dependency to the commit path. Asynchronous replication keeps the write path lighter but can lose not-yet-replicated commits if the leader is lost.
The choice follows RPO, RTO, and latency requirements.
Replica lag
Moving reads to replicas reduces primary load but can return stale data. The classic failure appears as:
write
immediately read
and the user cannot see their own write.
Solutions include reading from primary for a bounded period after a write, tracking a commit/log position and waiting until the replica catches up, or keeping strongly consistent endpoints on primary.
Replica lag must be observable as a real metric; "eventual" is not useful if the delay cannot be measured.
28. Change Data Capture
CDC reads changes from the database log instead of polling tables repeatedly.
transaction database
-> change log
-> CDC
-> queue / search / analytics / cache
It separates OLTP from reporting pressure, enables near-real-time derived views, and reduces coupling between downstream systems and source queries.
Oracle GoldenGate and Debezium are examples with different support, licensing, topology, and operational models. The selection is not simply "which is faster."
CDC does not automatically provide exactly-once external side effects. Log positions, transaction identity, and consumer idempotency remain part of the design.
29. Partitioning
Partitioning divides one logical table into physical pieces. Time-oriented data can be divided as:
2026-07
2026-08
2026-09
Partition pruning reduces scanned data, and dropping an old partition can be far cheaper than deleting billions of rows because it avoids row-by-row undo/redo, locking, and index maintenance.
If the partition key is absent from the predicate, the engine may need to inspect many or all partitions and the benefit disappears.
Local and global indexes
A local index follows partition boundaries and simplifies partition maintenance. A global index can serve cross-partition queries but makes partition maintenance more coupled and expensive.
There is no universal "always local" or "always global" rule. Query paths and lifecycle operations decide.
30. Sharding
Partitioning can occur inside one database. Sharding distributes data across multiple database nodes.
Range and hash distribution
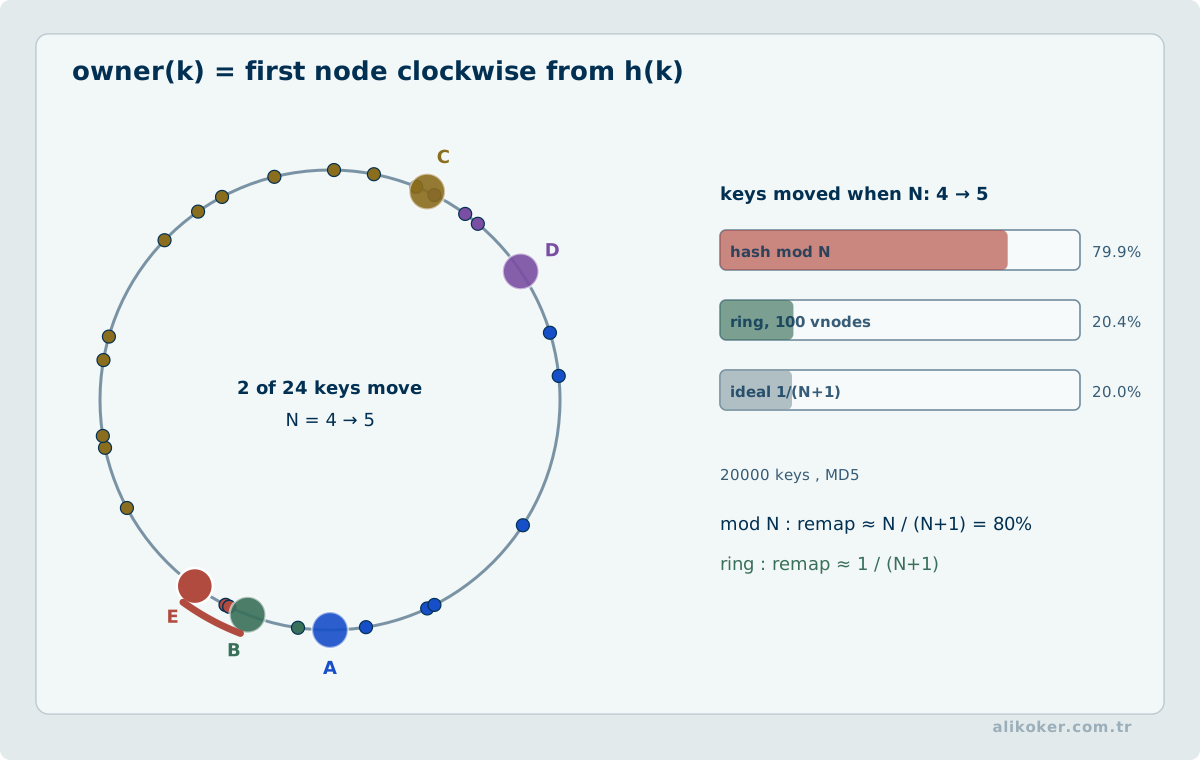
Range sharding preserves range scans but an increasing key can create one hot shard.
Hash distribution balances keys more evenly but can turn range queries into scatter/gather operations.
A composite concept such as:
partition key + sort keycan preserve efficient ranges within each partition.
Hot keys
Consistent hashing can distribute keys evenly without distributing requests evenly. One popular customer, account, or record can saturate its shard.
Measure access skew, not only key-count skew. Hot keys can require sub-sharding, caching, write combining, or a different data model.
Secondary indexes
A local secondary index makes writes local but can require searching every shard. A global secondary index narrows reads but introduces cross-shard write/coordination cost.
The trade-off remains:
cheap write -> expensive read
expensive write -> cheaper read
Distributed transactions
Once one business operation writes multiple shards, single-node transaction assumptions end. Options include distributed transactions, sagas, or redesigning the partition key so related state stays together.
The cheapest distributed transaction is the transaction that never had to become distributed.
31. Data model and access path
Normalization keeps one authoritative representation of a fact and simplifies write consistency. Denormalization can reduce joins but introduces synchronization responsibility for duplicated values.
A useful default is:
normalize authoritative state
derive specialized read views when justified
If a denormalized value changes, the update mechanism must be explicit: same transaction, CDC, event processing, or deterministic recomputation.
"We denormalized for performance" is not enough. State which read became cheaper, by how much, and how consistency is maintained.
32. Event sourcing and CQRS
In event sourcing, state transitions are first recorded as immutable events and read models are derived from them:
command
-> validation
-> event
-> materialized views
Benefits can include an audit trail, explicit causality, rebuildable read models, and the ability to create new projections from historical events.
Costs include event ordering, schema evolution, deterministic replay, suppression of repeated external effects, deletion/privacy requirements, and greater operational complexity.
CQRS and event sourcing are not defaults for ordinary CRUD. Use them when auditability, replay, and substantially different read models are actual requirements.
Replay must be deterministic. If an old event depends on today's exchange rate, current time, or a mutable remote response, replay can generate a different result unless the required historical input is stored or reproducibly queryable.
33. Schema evolution
Old and new application versions can coexist during deployment. Schema change is therefore a transition period, not a single deployment instant.
A safe expand-contract sequence is:
1. add the new structure
2. keep old code working
3. let new code read both forms
4. backfill if required
5. move all readers/writers
6. remove the old structure last
The same rule applies to API and message schemas: new readers should tolerate old data and old readers should tolerate new data where possible.
Binary schema formats can help with forward/backward compatibility through field IDs and defaults, but semantic compatibility matters too. Changing a field from meters to centimeters breaks meaning even if the wire type remains an integer.
Unit 6: Caching, Messaging, JVM, Networking, and Schema Ownership
34. Caching
Fix the source path first
A cache is not a substitute for a broken query. If a missing index is hidden behind a cache, the same failure returns on cache miss, restart, or mass expiry.
Cache layers
Common layers include:
- persistence context: transaction-local identity map,
- ORM second-level cache: entities across sessions,
- application cache: computed business results,
- remote shared cache: data across service instances,
- HTTP/CDN cache: response data closer to clients.
Each layer has a different invalidation boundary.
ORM second-level cache
It is valuable for frequently read, rarely modified reference data. On write-heavy transaction tables, invalidation and coordination can outweigh the read gain.
Native SQL, triggers, or another application can mutate the same table without the ORM cache automatically understanding the change.
Query cache
Many ORM query caches store entity identifiers rather than complete business responses. They must be evaluated together with the entity cache.
A high hit ratio is not meaningful if every write invalidates broad query-cache regions or if cache hits still trigger many entity loads.
Stampede
If a popular key expires simultaneously for hundreds of callers, they can all hit the source.
Techniques include single-flight/coalescing, TTL jitter, stale-while-revalidate, refresh-ahead, and source-aware rate limiting.
Negative caching
A costly "not found" can be cached briefly, but a long negative TTL can hide newly created data. Choose TTL from business semantics.
Caffeine: admission and refresh
Local-cache sizing is not always an entry count. If values have very different memory or load costs, use a weight model.
Caffeine's Window TinyLFU policy combines recency and frequency, helping protect the cache against scan-like patterns that can pollute plain LRU.
expireAfterWrite and refreshAfterWrite are different. Expiry can force a caller to wait for a new load. Refresh can asynchronously obtain a new value while serving the old value until the refresh completes. This can protect P99, but the acceptable staleness window is a business rule.
Measure more than hit ratio:
hit rate
miss rate
miss load cost
load failures
load P99
evictions / weight
cache size
A 99% hit rate is poor if the 1% misses can saturate the database.
Redis: pipelining is not atomicity
Redis pipelining reduces round-trip and socket overhead by sending several commands without waiting for each response. A giant pipeline can accumulate a large reply queue on the server, so bounded batches are safer.
Pipelining is a network optimization. MULTI/EXEC is transaction execution semantics. Do not use transactions merely to reduce RTT when atomicity is not required.
A two-level design:
L1 Caffeine
-> L2 Redis
-> DB
can reduce latency but creates a three-level invalidation problem. If L1 lives too long, Redis freshness becomes irrelevant. Use explicit versioning, invalidation events, or bounded TTLs.
35. Message queues
A queue does not remove load; it redistributes load over time.
The producer trades batching against waiting:
larger batch -> higher throughput, potentially more waiting
smaller batch -> less waiting, more protocol overhead
Partition count increases consumer parallelism, while ordering is preserved only within a partition.
Consumer lag is more than a queue metric. Replaying millions of records after an outage can hit the downstream database far harder than normal traffic.
Recovery should use bounded consumption, rate limits, and backpressure tied to downstream saturation. If processing is at least once, consumers must be able to process the same message safely again.
Kafka producer path
A Kafka producer batches records for the same partition. batch.size sets an upper batch bound; linger.ms bounds how long the producer can wait for more records before a non-full batch is sent. Kafka 4.0 changed the linger.ms default from 0 to 5 ms.
That is not an unconditional claim that five milliseconds is faster. At high arrival rates, batches often fill quickly and better batching can reduce protocol/network work enough to produce similar or lower effective producer latency. At low load, when inter-arrival time exceeds the linger interval and the batch does not fill, linger primarily adds waiting. Measure producer arrival rate, partition distribution, batch fill, and broker backpressure together (Apache Kafka 4.0 producer configuration).
Compression trades network and broker I/O for producer/broker/consumer CPU.
acks=all and idempotent production strengthen durability and suppress duplicates caused by producer retries. They do not automatically include an external database or HTTP side effect in the same transaction.
Partition count is also an ordering boundary. If events for one aggregate must remain ordered, the partition key must preserve that invariant. More partitions also increase metadata, file, rebalance, and operational cost.
Kafka transactions and the exactly-once boundary
Setting transactional.id enables the producer transaction APIs and implies idempotence. In a Kafka read-process-write path, consumed offsets and produced records can be committed in one Kafka transaction; consumers configured with isolation.level=read_committed then expose only committed transactional records. Kafka Streams EOS builds on the same boundary.
The guarantee is real, but its boundary matters:
Kafka offsets + Kafka output records
same Kafka transaction -> can be atomic

Kafka + Oracle/PostgreSQL + HTTP + files
one Kafka transaction -> not atomic
External side effects still require a transactional outbox, idempotency key, deduplication, or another explicit atomicity protocol (Apache Kafka 4.0 KafkaProducer/KafkaConsumer).
Kafka consumer path
The important question is not simply thread count; it is whether one poll's work completes within the consumer group's liveness/rebalance budget.
max.poll.records, fetch sizing, and max.poll.interval.ms interact. Fetching more records can improve transfer efficiency but can also make processing exceed the poll interval and trigger rebalances.
Offset commit must correspond to the completion point. Committing before work completes risks loss. Completing work and crashing before the commit creates replay. That is why idempotent consumers are the foundation of at-least-once processing.
Observe:
lag records
lag time
consume rate
produce rate
rebalances
processing P99
downstream saturation
Replay storms after outages should be limited by the safe recovery capacity of the database or downstream service, not by the consumer's theoretical maximum speed.
36. Backpressure and overload
A healthy system does not hide its capacity limit.
Prefer:
bounded queue
-> timeout
-> rate limit
-> load shedding
over an unbounded queue.
An unbounded queue converts overload into "accepted now, processed minutes later," eventually causing memory growth and timeout cascades.
Timeout budgets
If the top-level request has a 500 ms budget, giving three downstream calls 500 ms each is not a budget.
Partition the deadline across connection acquisition, queueing, query execution, and downstream work.
Cancellation must also release work. If the client timed out but the database query continues for minutes, the system did not shed load.
Retry storms
Layered retries multiply traffic:
1 user request
× 3 gateway attempts
× 3 service attempts
× 3 DB attempts
= 27 attempts
Own retries in one deliberate layer where possible, retry only classified transient failures, keep a total deadline, cap attempts, and use jitter.
Failure propagation, isolation, and steady state
Overload does not require unusually high incoming traffic. A single slow dependency can create the same condition. As call duration increases, requests retain threads, connections, transactions, or memory for longer; at the same arrival rate the number of in-flight operations rises.
slow dependency
-> resources retained longer
-> more in-flight work
-> queue growth
-> higher P99
-> timeouts
-> retries create additional load
From a capacity perspective, failed and slow are therefore not unrelated states. Slowness can amplify resource consumption until it propagates as failure.
Failure domains can be reduced by preventing every workload from sharing the same finite budget without a bound. Critical and expensive flows may need separate concurrency or worker budgets so that one class of work cannot exhaust another. The objective is not to create a pool for every feature, but to choose deliberately which functions are allowed to fail together.
A circuit breaker is useful in the same context. Its purpose is more than to count errors; it stops new work from accumulating against a dependency that is already failing or excessively slow, allowing local resources to be released. The open interval, probe traffic, and reintegration rate matter because a recovered dependency can otherwise be overloaded immediately by queued demand.
Steady-state validation also continues after the load ends:
queue -> baseline
connection wait -> baseline
heap / native memory -> expected operating band
consumer lag -> zero or normal level
temporary files / logs -> bounded growth
If the system cannot converge back toward its normal operating band, high benchmark throughput does not demonstrate stable long-running behavior.
Performance and resilience therefore meet at the same resource budget: capacity limits, fault isolation, and recovery are different views of the same system.
37. Access design in Oracle RAC
RAC provides access to the same database from multiple instances; it does not remove coordination cost for shared blocks. A hot key or right-growing index that does not scale on one instance can become more visible under Cache Fusion and global-cache coordination.
Patterns that magnify cluster cost include:
- heavy writes to the same hot row,
- broad low-selectivity scans,
- unnecessary index maintenance,
- long transactions,
- row-by-row operations,
- hot blocks repeatedly transferred between instances.
Sequence generation
When a sequence generates primary keys and global request ordering is not a business invariant, Oracle RAC guidance recommends CACHE with NOORDER for optimal sequence-generation performance. Cache size and tolerance for gaps are business/operational choices; ORDER adds coordination when global request order is actually required. Current Oracle releases also provide scalable sequences for highly concurrent loading.
uniqueness != gapless numbering
uniqueness != global temporal order
Choosing ORDER NOCACHE without that distinction can introduce an avoidable serialization point (Oracle RAC Design and Deployment Techniques).
Right-growing index contention
Monotonically increasing sequence or timestamp keys can focus inserts on rightmost B-tree leaf blocks. Under high write concurrency, especially across RAC instances, those hot blocks can become a throughput and tail-latency boundary.
There is no universal fix:
- reverse-key indexes spread inserts but sacrifice ordinary range scans,
- hash-partitioned global indexes can distribute a hot right edge but change access/partition costs,
- scalable or distributed key schemes can change insert locality,
- sometimes the correct fix is to remove the hot key from the data model.
Do not apply reverse-key or hash partitioning without AWR/ASH and actual wait-event evidence. The goal is not generic "RAC tuning"; it is to identify the block, index, or enqueue on which the workload serializes (Oracle SQL Tuning Guide; RAC documentation).
Adding RAC nodes does not remove a serialization point in the data model. If every transaction still waits on one hot key or lock, the work remains serialized.
38. Separate OLTP from analytical load
Protect the primary transaction database for short, selective, transactional, correctness-sensitive work.
Reports, historical scans, model training, time-series aggregation, and large exports can move to replicas, warehouses, columnar OLAP engines, or file/lakehouse systems.
CDC makes this separation more natural than repeatedly polling WHERE modified_at > ?, which can be fragile around indexes, clock/timestamp semantics, and deletes.
39. Search and vector indexes
B-tree is not the answer to every search problem.
Full-text search uses inverted indexes. Geographic access uses multidimensional structures. Similarity search uses vector indexes.
Approximate nearest-neighbor structures such as HNSW and IVF trade:
latency
memory
build cost
recall
update cost
A vector index does not replace a transaction primary key or relational constraint. Operational metadata can remain relational while semantic search is maintained as a derived vector view.
Keeping search as derived state makes it possible to rebuild the index from authoritative data after corruption or model changes.
40. JVM memory and garbage collection
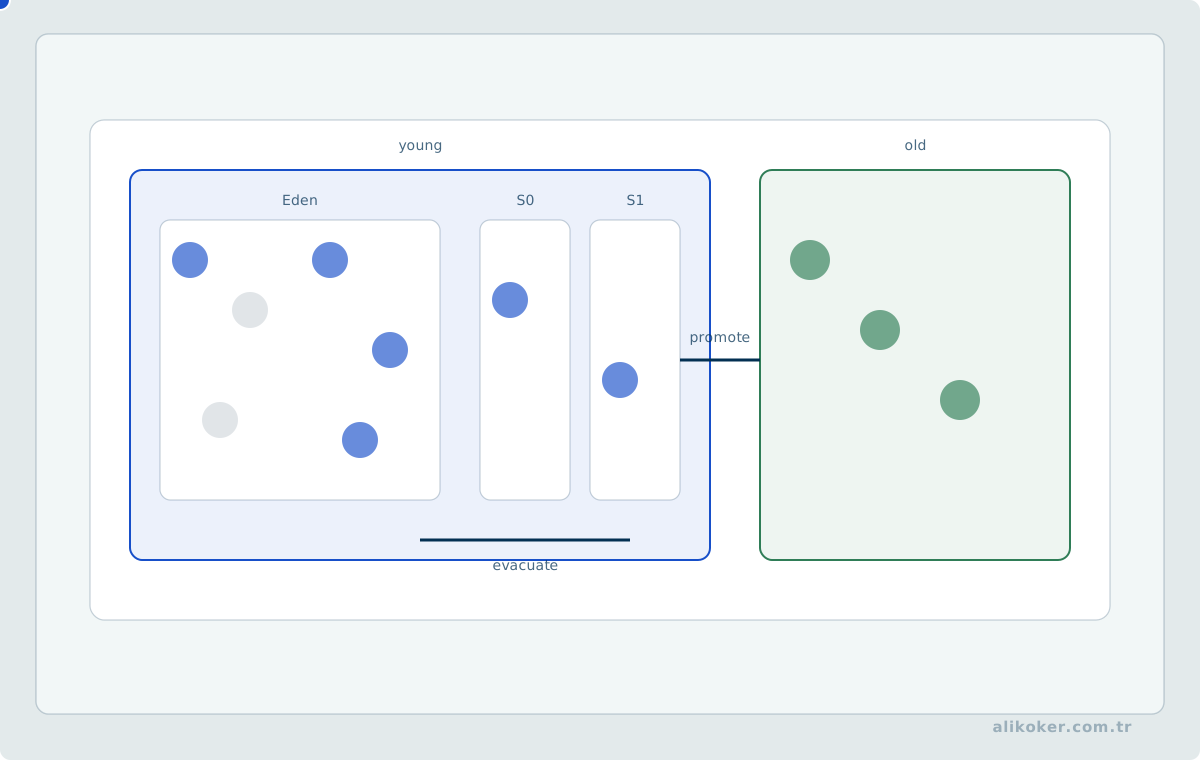
Allocation first
High allocation means:
more frequent GC
more memory bandwidth
more cache pressure
Common hot-path sources are large DTO graphs, unnecessary intermediate collections, string construction, JSON serialization, boxing, and materializing entire result sets.
Increasing heap size does not remove allocation; it only postpones collection.
G1, ZGC, and Parallel GC
Collector selection is a trade-off among:
throughput
latency
footprint
G1 is a balanced general-purpose collector. ZGC is a strong candidate when pause budgets are tight. Parallel GC remains useful when aggregate throughput matters more than pause time.
Do not choose an "absolute fastest GC" without the exact JDK version, heap, allocation rate, live-set size, and workload.
G1 details
G1 divides the heap into regions. Large objects can become humongous allocations with special placement and reclamation behavior. If hot paths create objects near or above the humongous threshold, first identify the allocation source rather than blindly changing region size.
A pause target is not a hard guarantee. The collector attempts to meet it within the available heap and allocation pressure. A heap with no headroom limits GC flexibility; an unnecessarily large heap increases RSS and cache footprint.
JEP 522 in JDK 26 reduced synchronization between application threads and G1's card-table optimization work, improving throughput for affected workloads. This is not a new universal tuning knob; it is another reason to re-run the same workload after a JDK upgrade.
Current ZGC behavior
Generational ZGC became the default ZGC mode in JDK 23. JDK 24 removed the non-generational mode via JEP 490, so current-JDK tuning notes that compare non-generational and generational ZGC are historical/version-specific (OpenJDK JEP 474, JEP 490).
ZGC performs much of its expensive work concurrently to minimize pauses, which requires CPU and memory headroom. Low pauses are not free.
Off-heap memory and heap headroom
Process memory is more than Java heap:
heap
+ metaspace
+ thread stacks
+ direct buffers
+ code cache
+ GC structures
+ native libraries
A container-aware JVM can see cgroup limits, but assigning the entire memory limit to -Xmx is still incorrect accounting. Native peaks, the operating system, and side processes need budget as well.
Ask:
how large is the live set?
what is the allocation rate?
what headroom does GC require?
what is the native peak?
how close is RSS to the cgroup limit?
CPU quota, cgroup throttling, and JVM ergonomics
Host core count alone does not describe a container's effective compute budget. When a cgroup CPU quota is exhausted within its period, the process can be throttled even while the host has idle cores; this can appear as periodic P99/P99.9 spikes.
The processor count visible to JVM ergonomics influences GC workers, JIT compiler threads, and some shared pools. -XX:ActiveProcessorCount can override detection when necessary, but a wrong value can create excessive runnable work and worsen throttling. Observe together:
container CPU usage
throttled periods / throttled time
run queue
GC/JIT worker behavior
P99 / P99.9
If CPU quota is a deployment parameter, reproduce that quota in the performance test.
Warmup, JIT, and deoptimization
A short benchmark is not steady state. Separate warmup, steady load, and measurement.
A long-running HotSpot process does not execute code in one fixed form. Interpretation and tiered compilation collect runtime profiles; hot methods receive progressively optimized code and inlining depends on observed call patterns. When assumptions become invalid, code can deoptimize and be recompiled. A latency spike is not automatically GC.
Use compilation/inlining logs for targeted investigations; JFR usually provides a more coherent production timeline.
CDS, AppCDS, and the Leyden AOT cache
CDS and AppCDS are not obsolete; they are historical and technical foundations of HotSpot's current AOT-cache path. Class Data Sharing reuses preprocessed class metadata to reduce startup work and some memory duplication.
Project Leyden extended that path:
JDK 24  JEP 483  AOT Class Loading & Linking
JDK 25  JEP 514  AOT Command-Line Ergonomics
JDK 25  JEP 515  AOT Method Profiling
JDK 26  JEP 516  AOT Object Caching with Any GC
JEP 483 can make classes available in a loaded/linked state from an AOT cache; JEP 515 makes profiles from a previous run available earlier to JIT compilation; JEP 516 makes advanced object caching available with any GC, including ZGC. These mechanisms target startup/warmup and footprint; they do not automatically accelerate a steady-state request hot path (OpenJDK JEP 483, 514, 515, 516).
Compact Object Headers
JEP 519 promoted Compact Object Headers from an experimental feature to a product feature in JDK 25. Reducing object-header overhead can reduce footprint and improve locality for object-dense heaps, indirectly reducing some GC pressure. JEP 519 explicitly did not make the compact layout the default; verify UseCompactObjectHeaders on the exact JDK build.
It does not remove unnecessary allocation. Compare object-size distribution, heap/RSS, allocation rate, GC cost, and application P99 under the same workload (OpenJDK JEP 519).
Direct buffers, metaspace, and classloader leaks
If RSS rises while heap remains stable, inspect direct buffers, native libraries, thread stacks, and class metadata. A classloader that remains reachable can keep classes alive and grow metaspace even when heap-object counts look normal.
Native Memory Tracking separates HotSpot native categories but does not track every third-party native allocation. Combine NMT with operating-system memory maps or native profiling when required.
NUMA and large pages
On large multi-socket systems and large heaps, remote NUMA access, TLB pressure, and page placement can become measurable. Huge pages, Transparent Huge Pages, and NUMA-related JVM/OS options are not universal accelerators. Change them only after measuring remote-memory behavior, page/TLB effects, GC, and P99 together.
GraalVM Native Image
Native Image performs ahead-of-time compilation under a closed-world reachability model. Dynamic reflection, resources, JNI, and serialization may require reachability metadata.
Its major advantages can be low startup time and lower memory footprint. Steady-state throughput is not guaranteed to exceed a warmed JIT service.
Profile-Guided Optimization can instrument a native executable, collect a representative profile, and rebuild with that profile. Current GraalVM documentation states that PGO is not available in GraalVM Community Edition. The comparison therefore includes distribution, licensing/procurement, and sustainable offline packaging—not only compiler output. Verify availability in the exact GraalVM distribution being deployed (GraalVM Native Image PGO documentation).
Native Image is especially attractive for startup-sensitive, short-lived, scale-to-zero, or footprint-constrained processes. Long-lived high-throughput services should compare it against warmed HotSpot under the same traffic, CPU quota, and memory budget.
41. Serialization and network
Fetching little data from the database and then constructing a huge JSON graph is not an optimization.
The response path includes:
DB bytes
-> Java objects
-> serialized bytes
-> network
-> client parsing
Discarding fields at the serializer is later and more expensive than never selecting them from the database.
HTTP connection reuse and multiplexing
Keep-alive amortizes TCP/TLS setup. HTTP/2 multiplexes several streams over one connection and compresses repeated headers with HPACK. This reduces connection churn but does not remove TCP-level loss behavior shared by streams on that connection.
HTTP/3 carries HTTP semantics over QUIC and changes transport behavior, especially for independent streams and lossy/high-latency networks. It does not fix a slow database, serializer, or application lock.
Compression
Compression is a trade-off among payload size, CPU, client support, bandwidth/RTT, and caching.
Large text responses can benefit from GZIP or Brotli. Tiny payloads can cost more CPU and framing than they save. Already compressed media such as JPEG, MP4, and ZIP should normally not be recompressed.
Jackson and the hot path
The Spring Boot 4 era overlaps with the Jackson 3 transition. Jackson 3 moved most Maven coordinates and Java packages from com.fasterxml.jackson to tools.jackson, but jackson-annotations is an explicit exception and remains on the 2.x com.fasterxml.jackson.annotation artifact/package line. Some annotations owned by databind or data-format modules do move. A blind global package replacement is therefore incorrect (FasterXML, Jackson 3 Migration Guide).
Benchmark conclusions from older Jackson 2 Afterburner/Blackbird configurations should therefore be revalidated on the exact Jackson and JDK versions rather than treated as timeless tuning advice.
First shrink the object graph:
fewer fields
fewer nested objects
fewer String conversions
fewer temporary collections
Then evaluate serializer choices.
Binary formats such as Protobuf, Avro, or MessagePack can reduce size or CPU in some paths, but they introduce schema, compatibility, tooling, and client costs. If JSON already meets the SLO, changing the wire format is not automatically performance engineering.
42. Schema ownership and ORM
An ORM cannot behave correctly without understanding schema semantics. Primary keys, unique constraints, foreign keys, indexes, and column types are part of the application access model, not only DBA concerns.
Conversely, a database team cannot design the right physical structures without knowing application predicates, cardinality, traffic, and SLOs.
A healthy boundary is:
application team:
  access pattern, business invariant, volume, SLO

database team:
  physical plan, indexes, statistics, storage, maintenance

shared:
  measurement and change outcome
Automatic live-schema mutation by the application is risky in controlled production environments. Schema change should be reviewable, versioned, observable, and have a rollback/forward-recovery plan.
Unit 7: Performance Testing, Capacity, and Optimization Decisions
43. Performance testing
Test data must approximate production volume, skew, and relationship density. One million uniform records do not model real selectivity or hot-key distributions.
Use separate scenarios for:
- cold start,
- warmed caches,
- steady load,
- ramps,
- spikes,
- long soak,
- failure and recovery,
- replica lag,
- backlog replay.
A performance test should produce pass/fail criteria rather than only graphs:
P99 < target
error rate < target
DB acquisition < target
query count <= limit
heap stable
backlog not growing
After the load ends, verify that resources recover. A queue that never drains or a heap that keeps growing is not stable behavior.
Microbenchmarks and JMH
Tools such as k6 and Gatling measure service/system paths; they are not the right resolution for serializer, allocation, collection, algorithm, or hot-method micro-costs. Naive System.nanoTime() loops on the JVM can be invalidated by dead-code elimination, constant folding, tiered compilation, inlining, or insufficient warmup.
JMH is the OpenJDK microbenchmark harness that controls warmup, measurement iterations, forks, state, and consumption patterns. Its result is still local to the behavior being measured:
JMH improvement
!=
service P99 improvement
If the optimized code is not a material share of the request profile, Amdahl's Law can erase the micro gain at system level.
Open and closed workload models
The load-tool brand matters less than the arrival model.
In a closed model, a virtual user waits for a response before issuing the next request. When the system slows, the generator also slows, hiding some of the queue pressure.
In an open model, arrivals are independent of service time:
target: 1000 requests/s
service slows
arrival remains 1000 requests/s
This better models an external traffic source and reduces coordinated-omission error.
k6 arrival-rate executors directly support open arrival models. Gatling can express constant and ramping arrival rates as well. If two tools produce materially different results for the same intended workload, validate the benchmark definition before tuning the application.
Traffic shapes
A single ten-minute constant-rate test is insufficient:
ramp      locate the capacity curve
steady    measure stable behavior
spike     expose queue/load-shedding limits
soak      expose leaks, compaction, GC, maintenance
recovery  expose backlog and reconnection behavior
Think time and pacing must represent the intended user/system behavior. If every virtual user repeatedly hits the same cache key, the test may be measuring cache locality rather than the service.
Experimental record and evidence boundary
Unless explicitly identified as measured data, numeric examples are illustrative and should not be interpreted as universal benchmark results from one hardware or institutional workload. A claim such as "this setting improved throughput by X%" is meaningful only with a reproducible experimental record.
Record at least:
- Hypothesis: Which physical work should decrease?
- Versions: JDK, framework, JDBC, DB, OS/kernel
- Resource budget: CPU quota/cores, memory, storage, network
- Data: row count, distribution/skew, cache state
- Workload: open/closed, arrival rate, concurrency, pacing
- Warmup: duration/iterations and steady-state criterion
- Result: throughput, P50/P95/P99/P99.9, errors
- Work amount: CPU, allocation, GC, DB blocks/rows, round trips, bytes
- Repetition: run count, variance/confidence interval
- Trade-off: CPU, memory, writes, consistency, operational cost
- Recovery: do queue/heap/backlog return to baseline?
When production measurements cannot be published because of privacy or institutional policy, state that boundary and publish the method, anonymized/synthetic reproduction, or qualitative observation instead. Do not invent unpublished numbers.
CI thresholds and regression analysis
Performance tests can be CI acceptance gates, but thresholds must exceed environmental noise. Pin hardware profile, kernel/runtime versions, dataset, and generator topology where practical. Use multiple runs when the expected difference is small.
Take JFR or flame graphs before and after a change. If P99 improves but allocation, block reads, CPU, and network work do not move, investigate measurement variance or a shifted bottleneck.
44. Capacity planning
Start from service-level requirements:
P99 target
error-rate target
peak requests/s
data growth
failure scenario
Then measure low-load service time, the saturation curve, and a safe operating point below the cliff.
A first instance-count estimate is:
peak load / safe capacity per instancethen add n-1, n-2, or broader failure headroom as required.
CPU alone is not a universal autoscaling signal. In I/O-heavy services, queue length, connection waiting, P99, and consumer backlog can show saturation earlier.
USE, RED, and deriving instance count from the bottleneck
Read RED at service level and USE for each critical resource. If CPU is 40% but the connection pool is saturated, a CPU-based capacity model is wrong.
Safe instance capacity is not the first point where errors appear. It is the point where the SLO begins to degrade with sufficient headroom for variance.
Burst and failure budgets
n-1 can represent more than one server. A database node, cache shard, availability domain, or network path can fail and redistribute work.
If failover leaves every surviving component at 100% utilization, the system is only moving from one failure into the next saturation cliff.
Cost per request
Cost is not only a cloud invoice. In private or isolated infrastructure it still means CPU-seconds, DB-seconds, IOPS, bytes transferred, GPU time, and operational capacity.
cost per work item = total resources consumed / completed workIf P99 improves while CPU per request doubles, record that trade-off.
Autoscaling must also include reaction time. If an instance takes 90 seconds to become ready, autoscaling cannot solve a five-second spike; headroom and load shedding must absorb it.
45. Optimization priority
The single slowest query is not always the highest-value target.
Example:
A: once/day × 5 s        = 5 s/day
B: 100/s × 20 ms         = 172,800 s/day of DB service time
A small improvement to B can create much more total capacity.
Prioritize by:
total resource consumption
× user impact
× change risk
46. Common mistakes
Copying tuning values
A maximumPoolSize=50 value from another system is not evidence. Database CPU, SQL service time, storage, network, and application-instance count may all differ.
Caching everything
A system that collapses after cache restart has hidden a capacity debt. Measure miss cost, not only hit rate.
Indexing everything
Unused indexes still consume write work, redo/WAL, storage, and cache.
Making everything an entity
Read-only lists and reports rarely need entity lifecycle. DTO/scalar projection is often clearer and cheaper.
Keeping transactions too broad
"One service method equals one transaction" can bind connection and lock lifetime to unrelated business work. The transaction should be the smallest boundary that protects the invariant.
Treating connections as capacity
More database sessions do not create more database CPU, IOPS, or lock parallelism.
Treating thread count as throughput
Waiting threads do not complete work. Virtual threads reduce the cost of waiting; they do not create downstream capacity.
Treating full scans as errors
The optimizer can intentionally choose a scan for low-selectivity predicates. Evaluate work, not ideology.
Treating native SQL as automatically faster
Native SQL can bypass ORM overhead, but it cannot rescue a bad plan, oversized result set, or excessive round trips. Bypass abstractions only for a measured reason.
Treating observability as free
High-cardinality metrics, verbose SQL logging, detailed NMT, and heavy tracing can become their own bottleneck. Measure diagnostic overhead and use high-cost tools deliberately.
47. Application decision sequence
If a read is slow:
1. is this data actually required?
2. are unnecessary rows returned?
3. are unnecessary columns returned?
4. are there too many queries?
5. are there too many round trips?
6. is there an appropriate index?
7. are cardinality estimates correct?
8. is the plan appropriate?
9. are locks, replica lag, or I/O dominating?
10. only then consider caching
If a write is slow:
1. is the transaction too long?
2. how many round trips occur?
3. is batching really active?
4. does the ID strategy break batching?
5. are there unnecessary indexes?
6. can row-by-row become set-based?
7. is there lock contention?
8. is WAL/redo/fsync the limit?
9. is storage write amplification the limit?
10. should this workload be separated?
If the system collapses under load:
1. where is the queue growing?
2. what is the arrival rate?
3. what is the service rate?
4. are timeouts effective?
5. are retries multiplying load?
6. is the pool waiting?
7. is the database saturated?
8. is there a cache stampede?
9. is backlog replay crushing the DB?
10. is load shedding available?
48. General conceptual framework
This entire note reduces to a small set of rules.
The bottleneck moves. When thread cost falls, the pool becomes visible. When SQL improves, serialization or network may become visible. A new bottleneck is often evidence of progress.
Every optimization has a cost. Indexes tax writes. Caches tax consistency. Batches tax latency. Replication taxes freshness or commit latency. Partitioning taxes operations. Denormalization taxes synchronization.
Abstraction does not remove physical work. JPA can hide SQL, but the database still executes plans against pages, locks, and logs.
Separate authoritative from derived state. Caches, search indexes, materialized views, and analytical copies are safer when they can be rebuilt.
Predictability is often worth more than peak speed. A stable P99 of 40 ms can be operationally better than a 10 ms average with regular two-second cliffs.
Keep the queue where it can be seen. A bounded application queue is easier to control than hidden connection, lock, or database work queues.
The fastest query is the query that never runs. Do not fetch unnecessary data, relationships, counts, or recompute results without need.
Correctness comes before performance. Removing unique constraints, isolation, identity, or idempotency to gain speed is not an optimization.
Tuning without measurement is a hypothesis. No profile, plan, or load test means no verified performance claim.
49. Fundamental distinctions
- Latency != throughput.
- Average != P99.
- Average of percentiles != combined percentile.
- Utilization != remaining capacity.
- CPU utilization != saturation.
- Thread count != real parallelism.
- Virtual threads != unlimited DB concurrency.
- Connection-pool size != database capacity.
- Connection wait != SQL execution time.
flush!=commit.flush!=clear.- Persistence context != second-level cache.
readOnly!= an absolute write-security boundary.IDENTITY!=SEQUENCE.- Primary key != merely a performance index.
- Unique constraint != application-side
existscheck. - N+1 != one slow query.
EAGER!= an N+1 solution.JOIN FETCH!= pagination.- DTO != entity.
- Fetch size != total result size.
- Offset pagination != keyset pagination.
COUNT(*)!= a mandatory part of every page.- Calling a batch API != proof of network batching.
- Row-by-row != set-based processing.
- Bind parameter != SQL text concatenation.
- Plan cache != result cache.
- Estimated rows != actual rows.
- Full scan != automatic error.
- Index scan != automatically faster.
- Index != free read acceleration.
- B-tree != the only index family.
- Partitioning != indexing.
- Partitioning != sharding.
- Replica != always-current copy.
- Asynchronous replication != zero data loss after commit.
- CDC != exactly-once external side effects.
- Cache != system of record.
- Materialized view != ordinary virtual view.
- OLTP != OLAP.
- Row storage != column storage.
- B-tree != LSM.
- Read amplification != write amplification.
- MVCC != serializability.
- Snapshot isolation != protection from write skew.
- Optimistic lock != complete business-invariant consistency.
- Deadlock != permanent failure.
- Retry != a solution for every error.
- Idempotency != an assumption that duplicates never happen.
- Event sourcing != the default for CRUD.
- CQRS != merely splitting read and write service classes.
- Schema change != one deployment instant.
- Native SQL != automatically fastest.
- Native image != a faster database.
- Larger heap != fewer memory problems.
- More servers != linear scaling.
- More metrics != better observability.
- Higher concurrency != higher throughput.
- Faster != better unless the cost is stated.
Zen summary
The note is long; the method is short:
measure
-> find the most expensive work
-> remove unnecessary work
-> bound concurrency
-> verify under the same load
-> record the trade-off
The first optimization is often subtraction:
- not running a query is better than making it faster,
- not fetching a row is better than serializing it faster,
- not retrying uselessly is better than creating more threads,
- keeping one transaction local is better than optimizing a distributed transaction,
- a small visible queue is better than a large hidden queue,
- stable P99 is better than an impressive average.
Zen here means removing unnecessary work, hidden state, and unverified tuning—not removing correctness, observability, or reliability.
Cache Correctness: Identity, Freshness, and Authorization Scope
Cache correctness is not only a TTL decision. If the same identity has different visibility or derived results under different user scopes, using only the object identity as the cache key can create both security and data-correctness problems.
A more realistic model is:
cache correctness
= correct identity
+ acceptable freshness
+ correct authorization/workspace scope
If metadata visible to a user depends on authorization scope, that scope must be explicit either in the key or in the loader contract. A cache must not become a second data-access path that bypasses authorization. This also connects caching to Secure Software Engineering.
Invalidation does not always require clearing the entire cache. A monotonically changing version for a scope or dataset can become part of the key:
entityId + scopeId + scopeVersionWhen authorization or scope changes, the version advances; old keys stop being read and disappear through normal eviction or TTL. Combined with a bounded cache, this can simplify invalidation logic. The cache must still have a hard size bound so version changes do not create an unbounded key space.
Coalescing concurrent misses for the same key into one source load is a practical form of the single-flight mechanism described earlier in the stampede section:
cache hit -> return
cache miss -> is a load already running for this key?
              yes: join it
              no: start one load
A negative result can also be cached briefly when it is expensive, but the system must distinguish “not found” from “not visible in this authorization scope.” A negative cache with ambiguous security scope can incorrectly transfer absence information between users.
Hit ratio alone is therefore not enough to judge a cache. The important questions are which identity the cache represents, under which authorization scope it is valid, how stale the value may become, and how many source calls a miss can trigger concurrently.
Related Java Deep Dives
Data-path and production performance are treated end to end. For a narrower JVM/JIT, GC and runtime analysis, see Runtime Optimization in Java Systems. For a compact implementation-oriented view of reflection, mapping and data-access mechanics, see Building a Reflection-Based ORM in Java.
Connections Across Performance Layers
In Java data systems, the same latency budget spans connection pools, JVM runtime behavior, concurrent data structures and flow-processing layers. The focused engineering problems for those layers are covered in:
- Oracle physical-session budgeting: Advanced Connection Pool Design with HikariCP,
- JIT, GC and hot-path costs: Runtime Optimization in Java Systems,
- CAS and cache-coherence: The Real Cost of Lock-Free Queues,
- flow-processing extensions: Developing a Custom Apache NiFi Processor in Java.
This keeps the broad performance framework intact while exposing focused answer pages.
Technical verification sources
- Hibernate ORM User Guide: https://docs.jboss.org/hibernate/orm/current/userguide/html_single/Hibernate_User_Guide.html
- Hibernate ORM Introduction: https://docs.jboss.org/hibernate/orm/current/introduction/html_single/Hibernate_Introduction.html
- Spring Framework, Declarative Transaction Implementation: https://docs.spring.io/spring-framework/reference/data-access/transaction/declarative/tx-decl-explained.html
- Spring Framework, Proxying Mechanisms: https://docs.spring.io/spring-framework/reference/core/aop/proxying.html
Queueing latency, coordinated omission, and percentiles
Average latency hides tail behavior. p50 describes typical requests while p95 and p99 reveal queueing and rare pauses. Measurements can still look artificially good when the load generator slows down whenever the server slows down; this is coordinated omission.
Open-loop generators keep arrival rate independent of response time and can expose saturation more clearly, while closed-loop clients may better model interactive users.
Near saturation, a small throughput increase can create a large tail-latency increase. Capacity planning should leave margin before that knee.
Making Java performance results reproducible
JVM performance should not be compared from one elapsed-time measurement. JIT warm-up, GC, CPU frequency, container/cgroup limits, and dataset shape all affect results. A harness such as JMH helps control pitfalls including dead-code elimination and constant folding.
A production incident is not the same as a microbenchmark. Thread dumps, JFR, GC logs, database plans, and application metrics can distinguish JVM, SQL, locking, network, and external-dependency causes.
A configuration is meaningfully “faster” only under comparable throughput, error rate, and resource budgets. Tail latency and allocation/GC behavior should accompany averages.
Limits of speedup and throughput under parallelism
Increasing the number of concurrent workers does not imply linear throughput growth. With a serial fraction s, and ignoring communication and synchronization overhead, the ideal Amdahl bound is
S(p) ≤ 1 / [s + (1−s)/p]Actual speedup commonly falls short because locks, connection pools, storage I/O, memory bandwidth and task scheduling introduce additional serial constraints. Parallelism may accelerate a few long-running jobs, but more concurrent requests against constrained resources can increase queueing delay and tail latency.
Partitioning statistical work assumes that local results can be combined in an admissible way. Mergeable counts and sums differ fundamentally from global optimization requiring coordination. With asynchronous parameter updates, workers may observe different versions of model state. Convergence results derived under bounded staleness do not guarantee behavior under unrestricted delays or failures. Where deterministic execution order is required, reproducibility cost must be assessed alongside the throughput benefit of asynchrony.
Correctness conditions for divide-and-conquer computation
Dividing large datasets can relieve memory pressure, but averaging local model parameters is not, in general, equivalent to optimizing the model over the full dataset. Heterogeneous distributions across partitions may introduce bias. A distributed speedup is meaningful only when partitioning, intermediate-result size, network transfer, combination rules and accuracy are measured together. The variation in numerical output across repeated runs of the same input also belongs in the performance report.
References
- Apache Software Foundation. Kafka 4.0 KafkaProducer and KafkaConsumer API. https://kafka.apache.org/40/javadoc/ (accessed August 25, 2026).
- Apache Software Foundation. Kafka 4.0 Producer Configuration. https://kafka.apache.org/40/generated/producer_config.html (accessed August 25, 2026).
- async-profiler. async-profiler. https://github.com/async-profiler/async-profiler (accessed August 25, 2026).
- Berenson, H.; Bernstein, P.; Gray, J.; Melton, J.; O'Neil, E.; O'Neil, P. “A Critique of ANSI SQL Isolation Levels.” SIGMOD Record, 24(2), 1995. https://doi.org/10.1145/568271.223785.
- Caffeine. Design, Efficiency and Refresh. https://github.com/ben-manes/caffeine/wiki (accessed August 25, 2026).
- Date, C. J. An Introduction to Database Systems. Addison-Wesley.
- Eclipse Foundation. Jakarta Persistence Specification. https://jakarta.ee/specifications/persistence/ (accessed August 25, 2026).
- Elmasri, R.; Navathe, S. B. Fundamentals of Database Systems. Pearson.
- FasterXML. Jackson 3 Migration Guide. https://github.com/FasterXML/jackson/blob/main/jackson3/MIGRATING_TO_JACKSON_3.md (accessed August 25, 2026).
- Garcia-Molina, H.; Ullman, J. D.; Widom, J. Database Systems: The Complete Book. Pearson.
- Goetz, B. et al Java Concurrency in Practice. Addison-Wesley, 2006.
- GraalVM. Native Image — Profile-Guided Optimization. https://www.graalvm.org/latest/reference-manual/native-image/optimizations-and-performance/PGO/basic-usage/ (accessed August 25, 2026).
- Grafana Labs. k6: Open and Closed Models. https://grafana.com/docs/k6/latest/using-k6/scenarios/concepts/open-vs-closed/ (accessed August 25, 2026).
- Gregg, B. Systems Performance: Enterprise and the Cloud. 2nd ed. Addison-Wesley, 2020.
- Gunther, N. J. Guerrilla Capacity Planning. Springer, 2007.
- HdrHistogram. HdrHistogram and Coordinated Omission. https://github.com/HdrHistogram/HdrHistogram (accessed August 25, 2026).
- HikariCP. About Pool Sizing. https://github.com/brettwooldridge/HikariCP/wiki/About-Pool-Sizing (accessed August 25, 2026).
- IETF. RFC 9113: HTTP/2. https://www.rfc-editor.org/rfc/rfc9113.
- IETF. RFC 9114: HTTP/3. https://www.rfc-editor.org/rfc/rfc9114.
- Inan, U. Spring Boot 4 Performance in Practice. Leanpub, 2026. DOI: 10.5281/zenodo.20370827.
- Kingman, J. F. “The Single Server Queue in Heavy Traffic.” Mathematical Proceedings of the Cambridge Philosophical Society, 57(4), 1961, 902-904. https://doi.org/10.1017/S0305004100036094.
- Kleppmann, M.; Riccomini, C. Designing Data-Intensive Applications: The Big Ideas Behind Reliable, Scalable, and Maintainable Systems. 2nd ed. O'Reilly Media, 2026.
- Köker, M. A. Kurumsal Veri Tabanı Erişim Katmanı Optimizasyonu. T.C. İçişleri Bakanlığı Arge Notları, December 22, 2025. Unpublished internal engineering note.
- Köker, M. A. Kurumsal Veri Tabanı İndeksleme Gereksinimi. T.C. İçişleri Bakanlığı Arge Notları, December 12, 2025. Unpublished internal engineering note.
- Micrometer. Histograms and Percentiles. https://docs.micrometer.io/micrometer/reference/concepts/histogram-quantiles.html (accessed August 25, 2026).
- Mihalcea, V. High-Performance Java Persistence. Leanpub version, June 9, 2020. https://vladmihalcea.com/books/high-performance-java-persistence/
- Mor Harchol-Balter. Performance Modeling and Design of Computer Systems: Queueing Theory in Action. Cambridge University Press, 2013.
- Nygard, M. T. Release It!: Design and Deploy Production-Ready Software. 2nd ed. Pragmatic Bookshelf, 2018.
- OpenJDK. Java Microbenchmark Harness (JMH). https://openjdk.org/projects/code-tools/jmh/ (accessed August 25, 2026).
- OpenJDK. JEP 444: Virtual Threads. https://openjdk.org/jeps/444.
- OpenJDK. JEP 474: ZGC: Generational Mode by Default. https://openjdk.org/jeps/474.
- OpenJDK. JEP 483: Ahead-of-Time Class Loading & Linking. https://openjdk.org/jeps/483.
- OpenJDK. JEP 490: ZGC: Remove the Non-Generational Mode. https://openjdk.org/jeps/490.
- OpenJDK. JEP 491: Synchronize Virtual Threads without Pinning. https://openjdk.org/jeps/491.
- OpenJDK. JEP 514: Ahead-of-Time Command-Line Ergonomics. https://openjdk.org/jeps/514.
- OpenJDK. JEP 515: Ahead-of-Time Method Profiling. https://openjdk.org/jeps/515.
- OpenJDK. JEP 516: Ahead-of-Time Object Caching with Any GC. https://openjdk.org/jeps/516.
- OpenJDK. JEP 519: Compact Object Headers. https://openjdk.org/jeps/519.
- OpenJDK. JEP 522: G1 GC: Improve Throughput by Reducing Synchronization. https://openjdk.org/jeps/522.
- OpenJDK. JEP 525: Structured Concurrency (Sixth Preview). https://openjdk.org/jeps/525.
- Oracle. JDBC Developer's Guide — Statement and Result Set Caching. https://docs.oracle.com/en/database/oracle/oracle-database/26/jjdbc/statement-and-resultset-caching.html (accessed August 25, 2026).
- Oracle. Oracle Database Concepts. https://docs.oracle.com/en/database/oracle/oracle-database/ (accessed August 25, 2026).
- Oracle. Oracle Database SQL Tuning Guide. https://docs.oracle.com/en/database/oracle/oracle-database/ (accessed August 25, 2026).
- Oracle. Oracle RAC — Design and Deployment Techniques. https://docs.oracle.com/en/database/oracle/oracle-database/26/racad/design-and-deployment-techniques.html (accessed August 25, 2026).
- PgBouncer. Configuration. https://www.pgbouncer.org/config (accessed August 25, 2026).
- pgJDBC. Server Prepared Statements and Driver Configuration. https://jdbc.postgresql.org/documentation/server-prepare/ (accessed August 25, 2026).
- PostgreSQL Global Development Group. PostgreSQL 18 Documentation. https://www.postgresql.org/docs/18/ (accessed August 25, 2026).
- PostgreSQL Global Development Group. PostgreSQL 18 — Multicolumn Indexes. https://www.postgresql.org/docs/18/indexes-multicolumn.html (accessed August 25, 2026).
- PostgreSQL Global Development Group. PostgreSQL 18 — PREPARE. https://www.postgresql.org/docs/18/sql-prepare.html (accessed August 25, 2026).
- Red Hat / Hibernate. Hibernate ORM User Guide. https://hibernate.org/orm/documentation/ (accessed August 25, 2026).
- Redis. Pipelining. https://redis.io/docs/latest/develop/using-commands/pipelining/ (accessed August 25, 2026).
- Silberschatz, A.; Korth, H. F.; Sudarshan, S. Database System Concepts. McGraw-Hill.
- Spring. Spring Boot Reference Documentation. https://docs.spring.io/spring-boot/reference/ (accessed August 25, 2026).
- Spring. Spring Framework Reference — Data Access and Transaction Management. https://docs.spring.io/spring-framework/reference/data-access.html (accessed August 25, 2026).
- Yarımağan, Ü. Veri Tabanı Sistemleri.
- Walter W. Piegorsch, Richard A. Levine, Hao Helen Zhang, Thomas C. M. Lee (eds.). Computational Statistics in Data Science. Wiley, 2022. ISBN 9781119561071.