


Analytical Database Systems: OLAP and ClickHouse


OLAP theory, column-oriented storage, ClickHouse MergeTree, SQL execution and optimization, distributed analytics, Oracle CDC, security, and performance engineering.
Online transaction processing (OLTP) optimizes short, highly concurrent transactions that locate and modify relatively few records while preserving transactional guarantees. Online analytical processing (OLAP) instead evaluates scans, filtering, joins, grouping, and statistical functions over substantial datasets. The distinction concerns workload shape, physical layout, consistency requirements, and resource allocation, not merely whether a query contains SELECT. Oracle, PostgreSQL, and MySQL can run analytical queries, but separating an operational source from a ClickHouse analytical replica allows each system to be designed for its principal workload.
ClickHouse is a column-oriented analytical database management system. Its MergeTree family combines sorted immutable data parts, sparse primary indexes, compression, partition pruning, vectorized execution, and parallel aggregation. Its performance depends on the distribution and ordering of data, the number of columns actually read, the query plan, and contention for CPU, memory, network, and storage bandwidth. It is not a drop-in replacement for a general-purpose transactional database.
Unit 1: Foundations of OLTP, OLAP, and HTAP Systems
Transactional and analytical systems are not merely different products; they optimize different access patterns. Point row access and wide column scans explain why their storage layouts diverge.
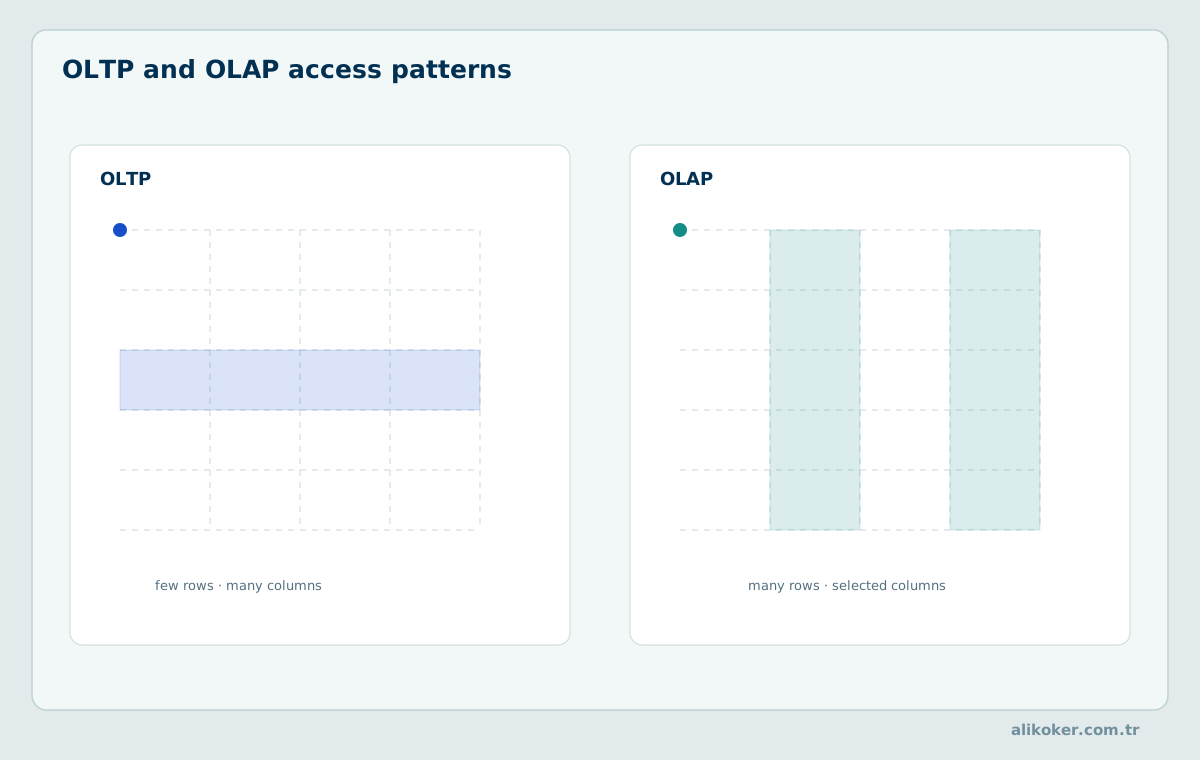
The operational/analytical distinction must be specified in terms of record access, isolation, data freshness, concurrency, and service-level objectives. A system may provide both interfaces while using separate physical representations internally. Moving analytical reads away from a transactional server reduces some resource contention, but change-data capture and the initial snapshot still place a measurable load on the source.
1.1. Workload Characteristics of Transactional and Analytical Queries
The physical cost of a transactional query is usually concentrated on a narrow index path and a small row set, while analytical work scans a much broader region, filters it, and reduces it into aggregates. The same SQL language can therefore require very different storage and execution designs.
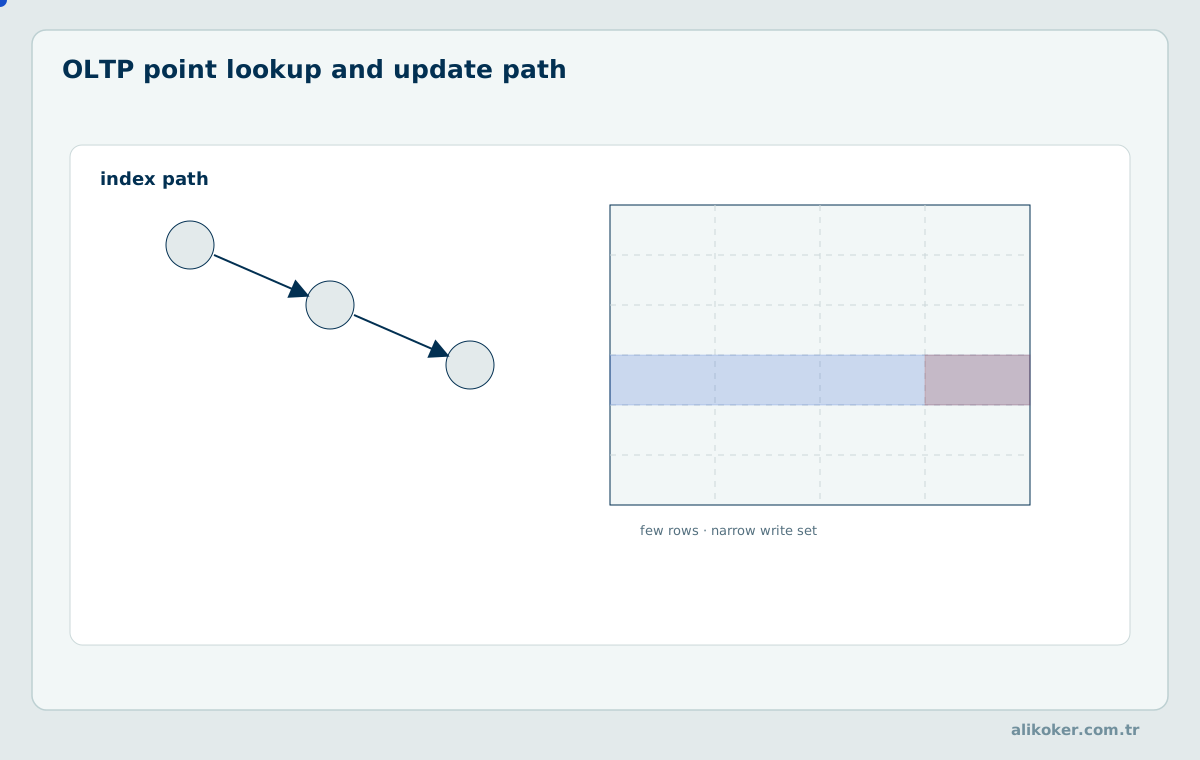
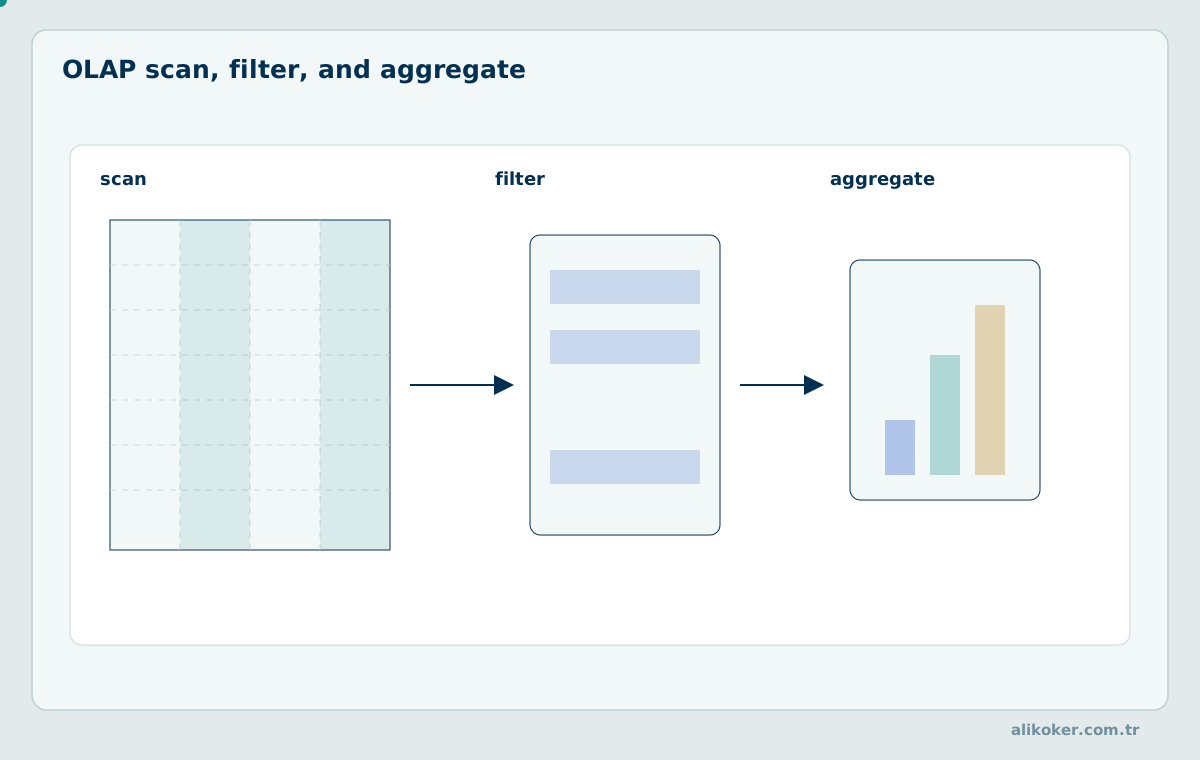
A point lookup with a selective index has a different I/O profile from grouping a billion events by hour. Classify workload samples by scanned bytes, selected columns, predicate selectivity, grouping cardinality, response size, update frequency, and concurrent request count. SELECT alone does not identify an OLAP query, just as INSERT ... SELECT is not necessarily transactional in purpose.
Operational and analytical traffic should be characterized with measured access distributions. A point lookup over a few mutable rows is different from a selective date-range aggregation reading millions of encoded values, even when both use SQL SELECT. OLTP design commonly emphasizes small index traversals, short lock or MVCC lifetimes, and predictable per-transaction completion. OLAP design commonly emphasizes column elimination, vectorized scans, aggregation parallelism and bounded intermediate state. Mixed workloads create competition for CPU caches, I/O and memory. An architectural separation is justified when isolating these resources produces a demonstrable benefit after accounting for change propagation and duplicated storage.
1.2. ACID, Isolation, Concurrency, and Data Consistency
ACID is not merely a list of abstract properties. Atomicity determines whether several changes become visible as one outcome, while isolation determines which versions concurrent readers and writers may observe. MVCC is a common way to separate readers from long-running writes.
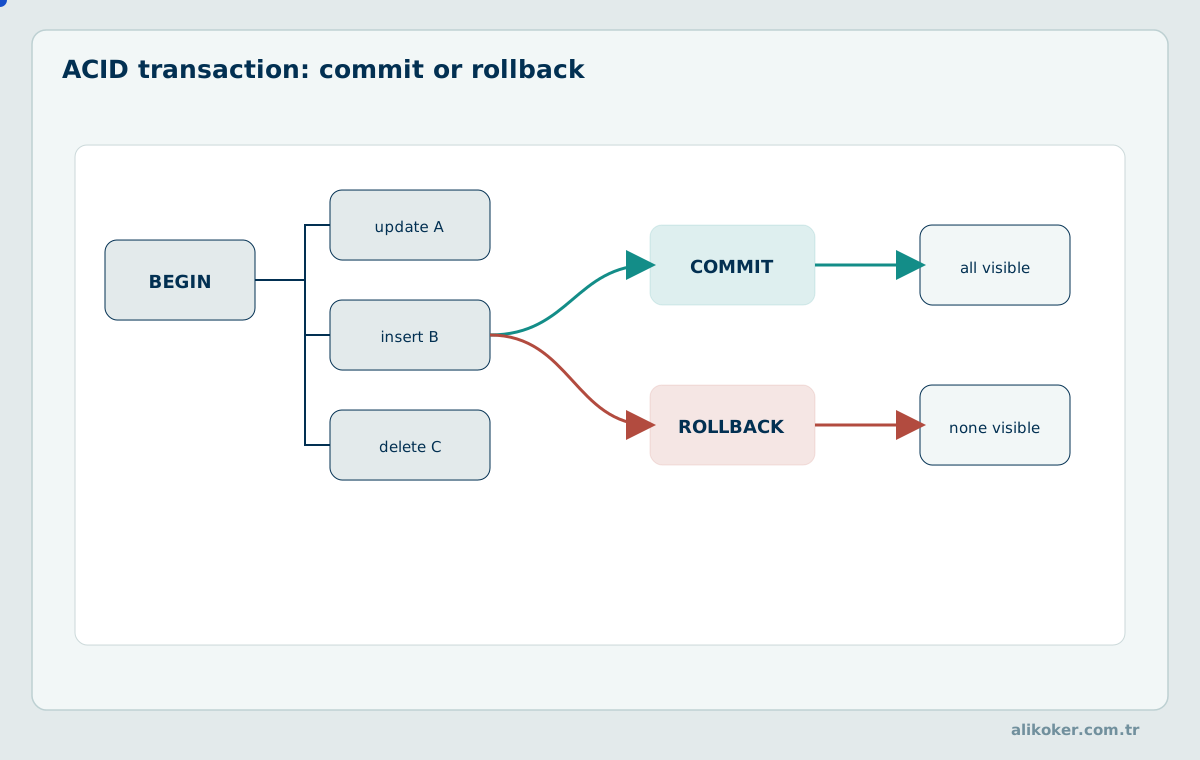
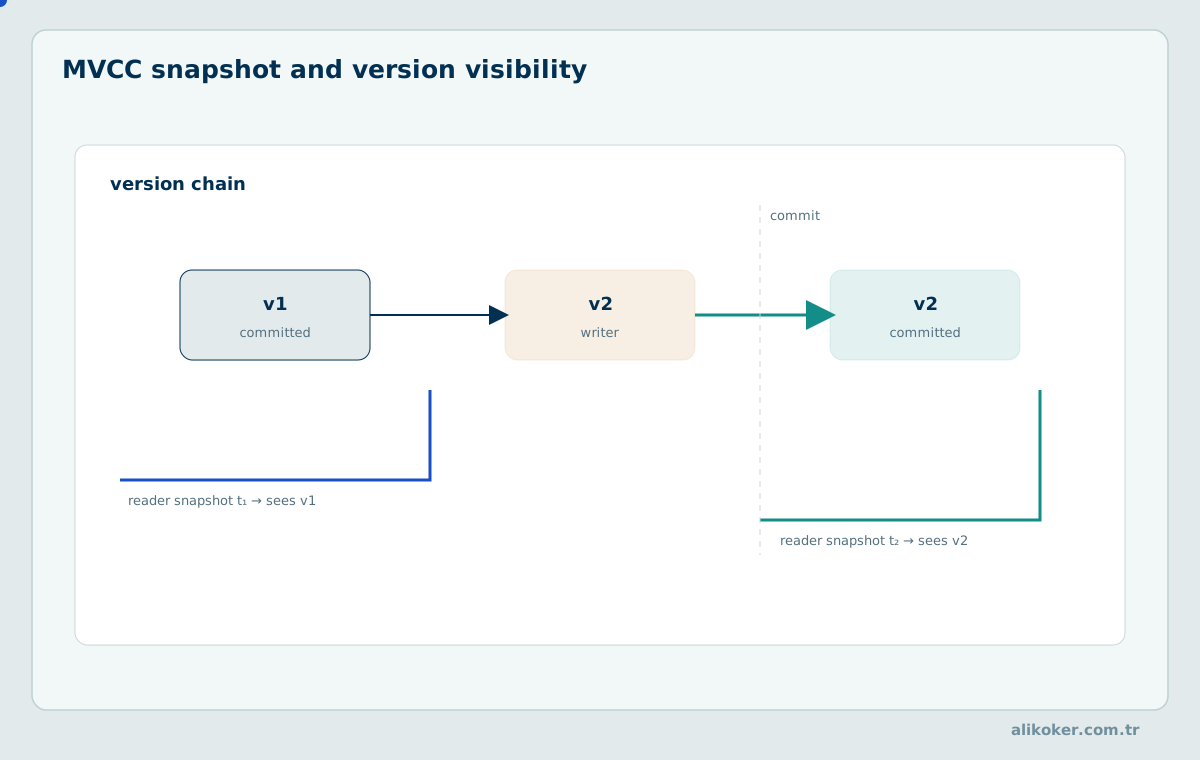
Atomicity, consistency, isolation, and durability express different guarantees. Atomic visibility of a ClickHouse insertion batch does not imply that several target tables reproduce one Oracle transaction atomically. For change-data capture (CDC), examine source commit order, restart offsets, schema evolution, duplicate delivery, and the visibility boundary of each target query. The operational definition of consistency must identify the point in source history against which analytical results are compared.
A detailed discussion of general relational transactions and isolation appears in Database Management Systems.
ACID is not one indivisible guarantee. A single insert statement can have atomic visibility while a multi-statement workflow lacks the isolation or rollback semantics of an OLTP transaction. A source Oracle commit that updates two relations may be delivered as separate analytical inserts, exposing an intermediate report state. Explain correctness in terms of observable source positions and target table versions rather than assuming that a successful insert proves cross-table atomicity. Replication, mutation and distributed query consistency must each be evaluated at their own scope. The acceptable degree of freshness is a business rule distinct from transaction isolation.
1.3. Comparative OLTP–OLAP Cost Models
A cost model cannot be reduced to row count alone. Bytes read, selected columns, selectivity, compression, CPU work, and inter-node coordination all shape total cost. Pruning and data-skipping mechanisms matter because they reduce that physical work.
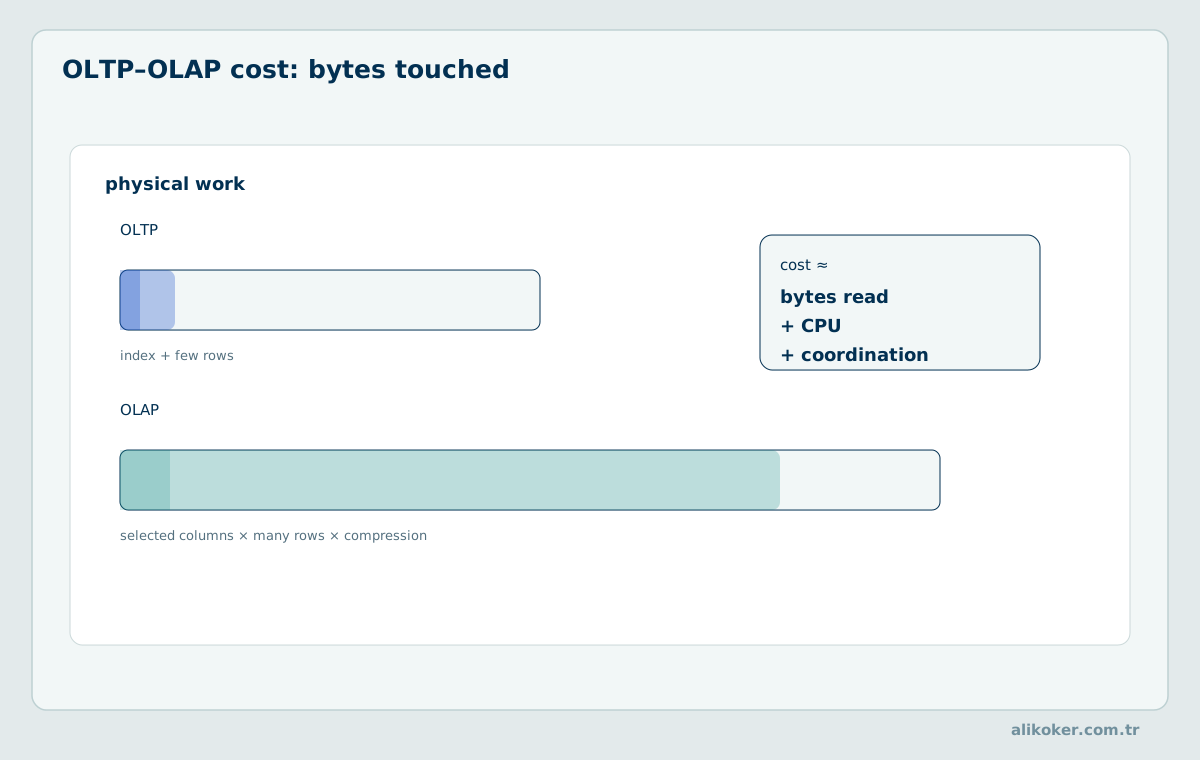
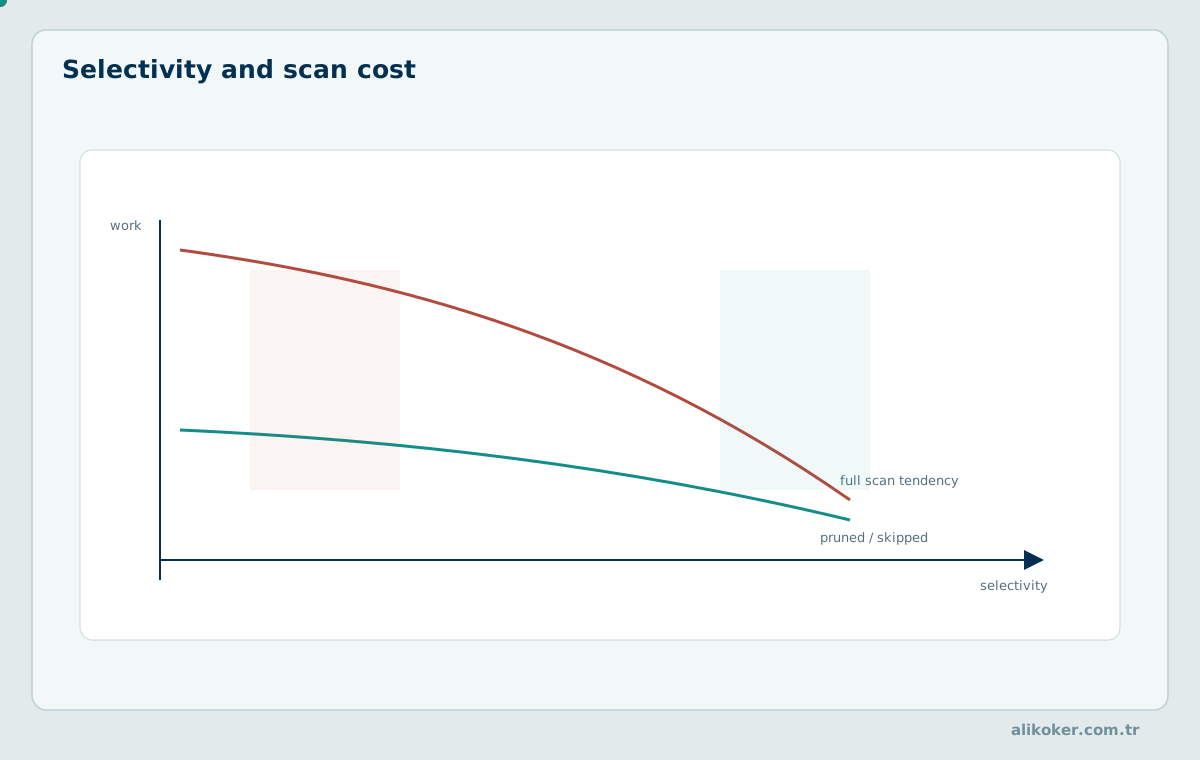
Let R denote rows considered, f the fraction of rows represented by granules that survive pruning, bⱼ the compressed bytes per row of selected column j, and β the effective storage bandwidth. A first approximation is B ≈ R × f × Σⱼbⱼ and T_IO ≥ B/β. CPU and I/O can overlap, so end-to-end latency is often better approximated by max(T_CPU,T_IO) plus network, sorting, and fixed overhead rather than by a simplistic sum. Measure actual read bytes and processed rows to test this model.
Worked comparison: suppose one billion events contain an eight-byte timestamp and a two-byte category. A column-only scan of these two uncompressed fields reads about 10 GB before metadata overhead. At an effective 2 GB/s, the physical transfer alone requires roughly five seconds. Fourfold compression lowers stored bytes to about 2.5 GB; if a suitable ordered index further reduces the scanned fraction to 2%, the idealized read volume becomes approximately 50 MB. Real granules, decompression blocks, and CPU work prevent this from being a latency guarantee. The example illustrates why a blanket claim of millisecond response over arbitrary billion-row queries is unsound.
A cost comparison should distinguish the bytes fetched from storage from the logical size of the table. Let N be the number of records, s the predicate selectivity, g the fraction of indexed granules that cannot be eliminated, C the set of referenced columns, and bⱼ the average compressed width of column j. A first-order scan estimate is B ≈ N·g·Σⱼ∈C bⱼ; replacing g with s assumes an unrealistically perfect physical index. Reading 1 billion records of two 8-byte columns costs 16 GB before compression, whereas a fourfold compression ratio and pruning to 2% of granules reduce the idealized transfer to 80 MB. Actual latency also includes decompression, merging mark ranges, network exchange, and aggregation. If a selective OLTP B-tree returns ten rows, its index traversal and random reads can outperform a broad column scan. Query classes, not vendor names, determine the appropriate comparison. Bandwidth measurements and cache state must accompany any elapsed-time estimate.
1.4. HTAP and Mixed-Workload Architectures
The central HTAP question is not simply whether both workloads can run on one node, but how transactional correctness and analytical access are combined under explicit resource boundaries. A change-stream architecture can prevent large scans from disturbing the transactional queue.
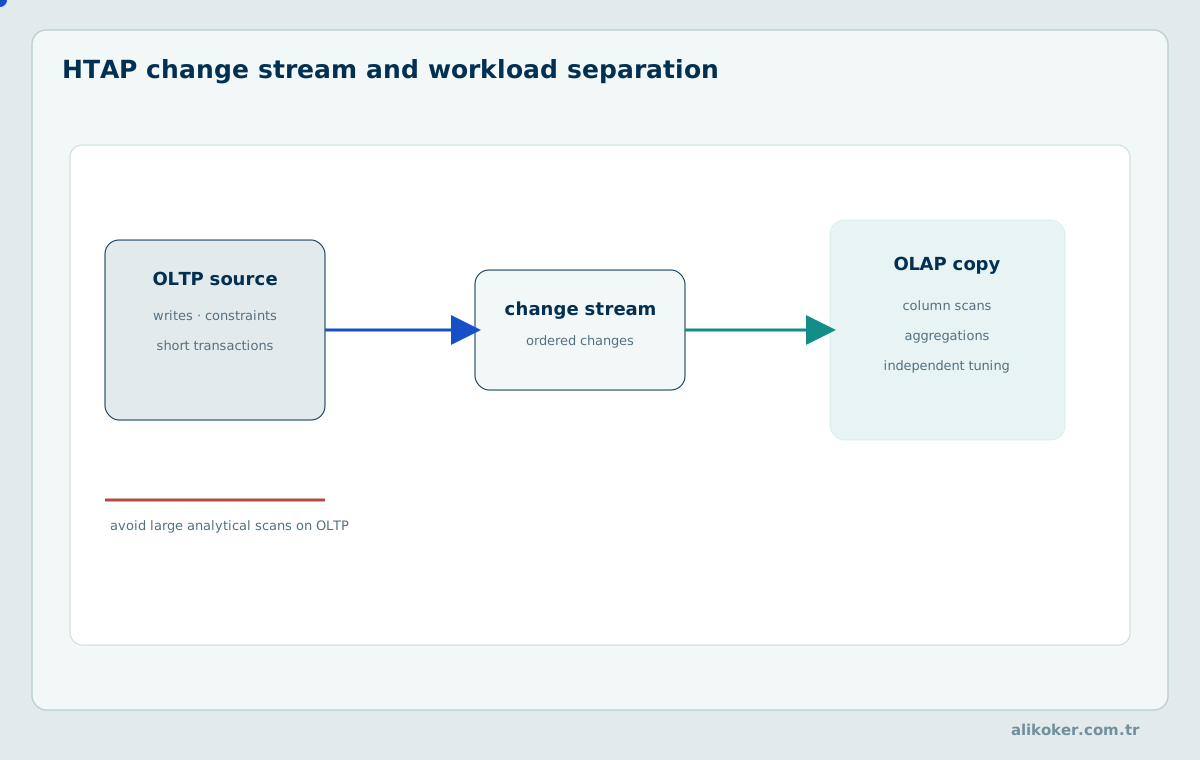
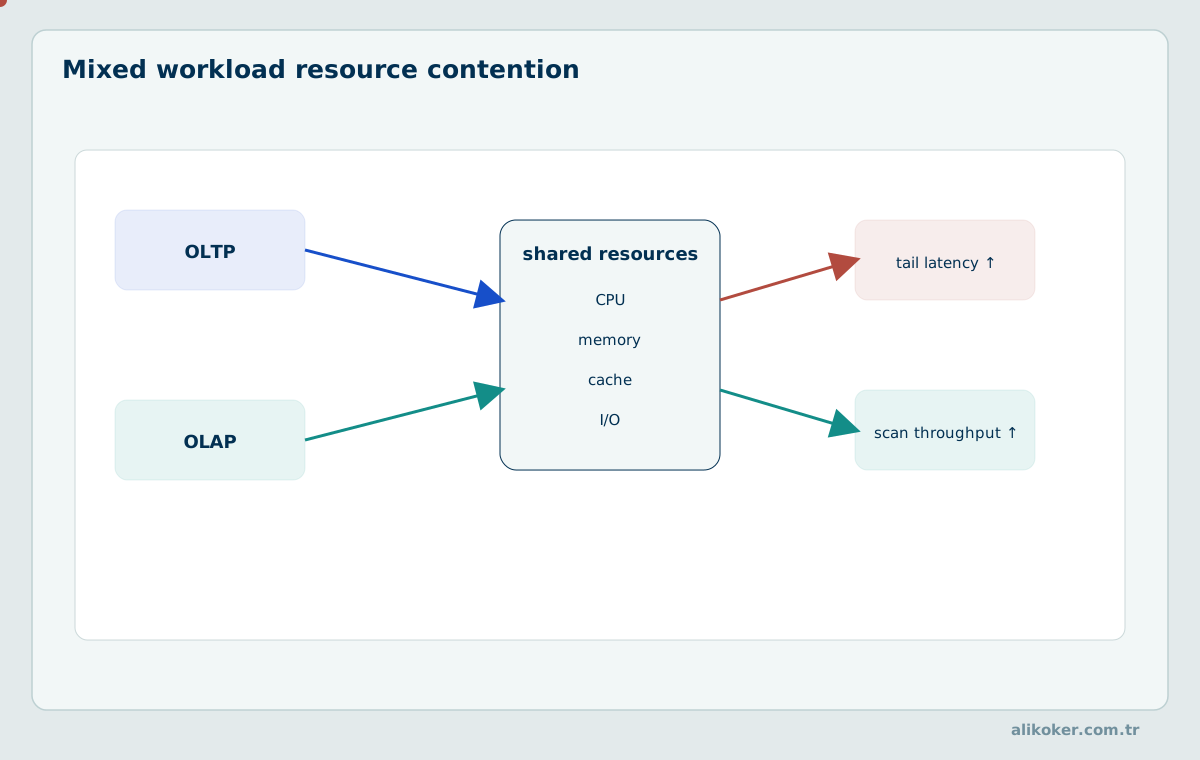
Hybrid transactional/analytical processing (HTAP) can combine transactional and analytical facilities within one product or across specialized engines. A common SQL endpoint does not imply a common storage representation. Evaluate propagation latency, snapshot correctness, write amplification, resource isolation, and the cost of maintaining an additional column-oriented copy. A replicated analytical target may intentionally trade immediate visibility for much faster aggregate queries.
HTAP aims to support both operational and analytical processing, either through specialized storage paths in one system or through synchronized engines. A shared SQL interface says little about whether row-oriented and column-oriented workloads compete for resources. Maintaining analytical replicas moves most report scans off the source but incurs CDC capture cost and delayed visibility. Evaluate network partitions and target reconstruction alongside query acceleration. A design appropriate for hourly financial reports may be inappropriate for decisions requiring the exact current transactional state.
1.5. Latency, Throughput, Freshness, and Query Complexity
Analytical freshness should be expressed as an explicit time boundary. The gap between the source head and the watermark applied by the analytical copy is the actual lag. Larger batches can improve throughput while changing single-event latency and visibility delay.
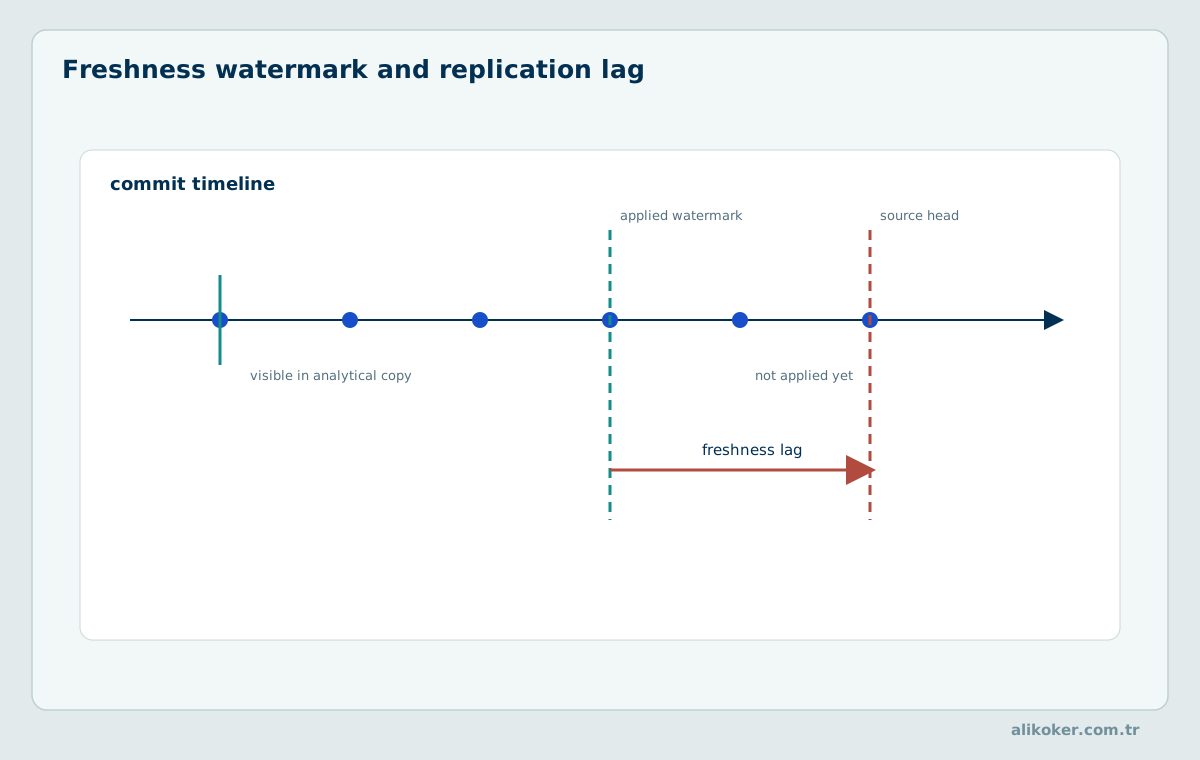
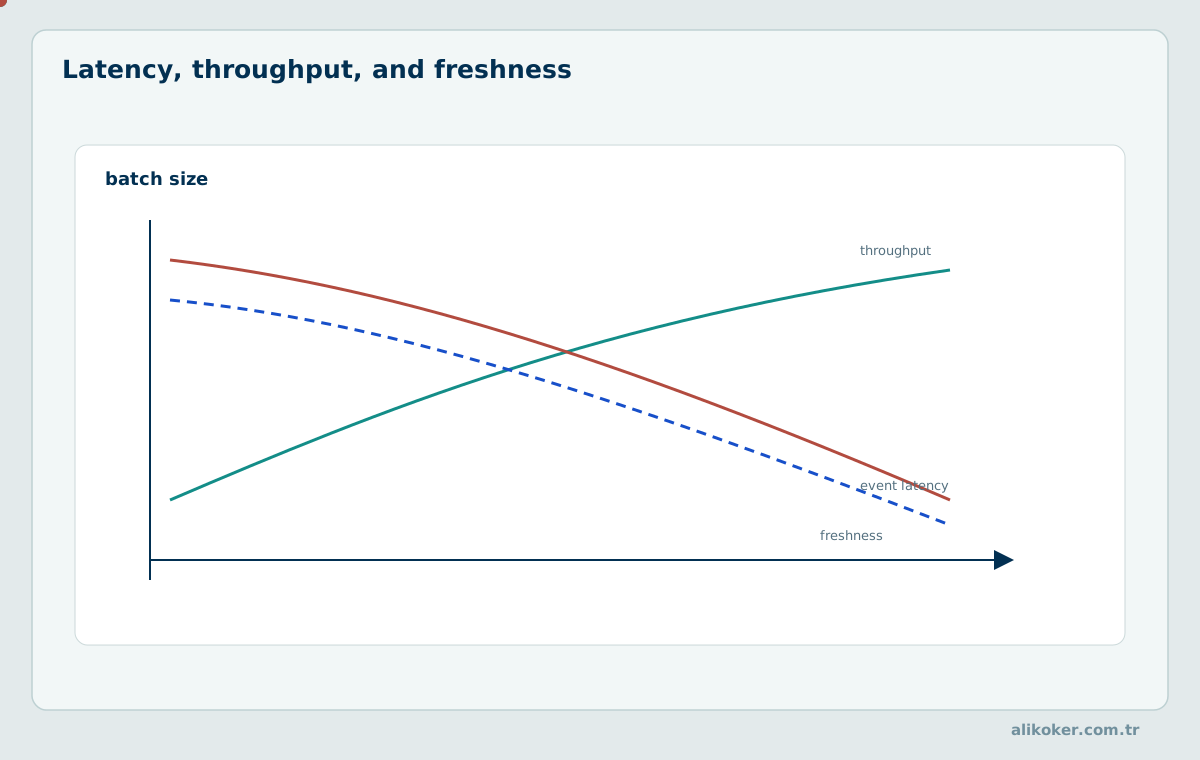
Latency is the response time of one operation; throughput counts completed operations or processed events per unit time. Data freshness is a separate measurement between a committed source event and its analytical visibility. For a stable system Little's law relates average concurrency L, arrival rate λ, and residence time W through L = λW. Average latency cannot substitute for p95/p99 under bursty concurrent demand.
Mean latency obscures queuing delays under bursts. Record p50, p95 and p99 together with offered arrival rate, completed request rate and timeout count. Little's law L = λW relates average concurrency, arrival rate and time in the system under stability; it does not assert that every individual request satisfies that relationship. Freshness should be measured from a source commit to visibility of the corresponding target state, not solely until Kafka accepts a message. Query complexity also matters: two queries with equal scanned bytes may differ by distinct grouping cardinality or the volume exchanged by distributed joins.
1.6. Source-of-Truth Guarantees and Responsibilities of Analytical Copies
A faster analytical copy does not automatically become the authority for correctness. The transactional source preserves commit order and business rules, while the analytical copy should remain rebuildable and reconcilable at explicit watermarks using row counts, aggregates, or suitable checksums.
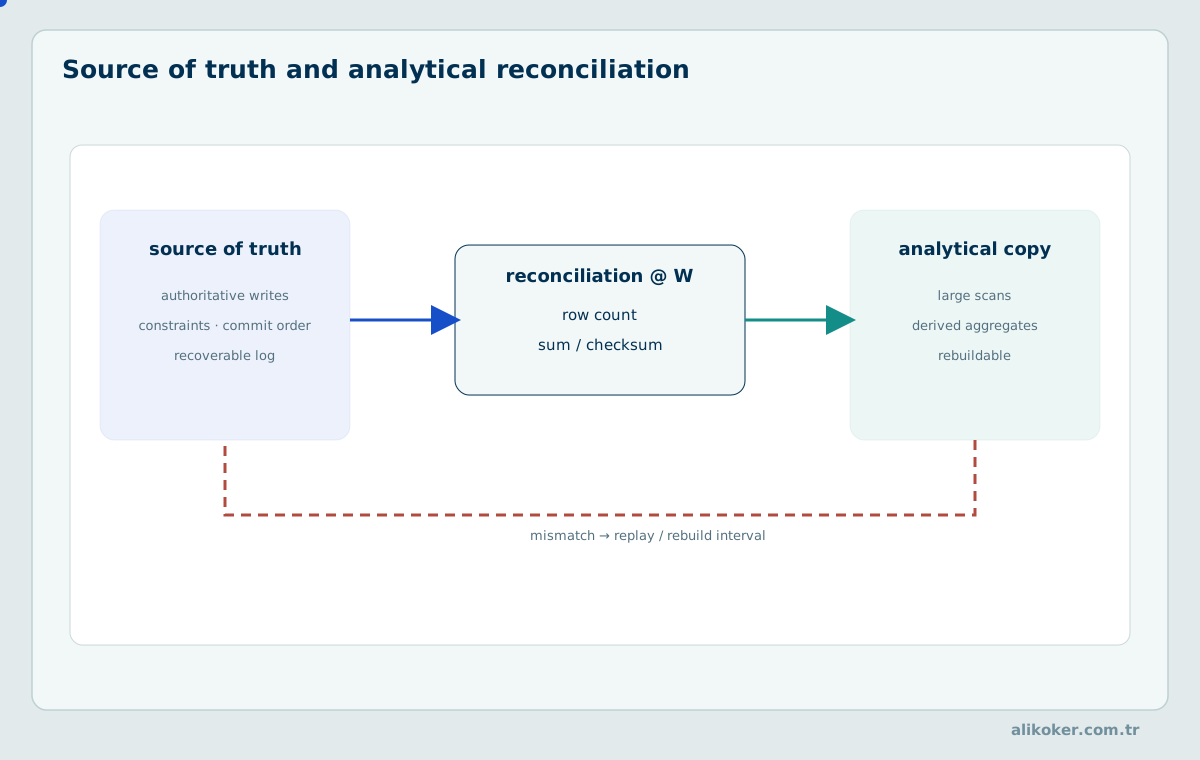
The operational database remains authoritative for modifications and business invariants. The analytical copy must specify what source commit sequence is represented, how replays are deduplicated, and how deletions and late corrections are applied. Comparing aggregate totals without accounting for nulls, event versions, and delayed delivery can produce superficially consistent but incorrect results. Reconciliation should therefore include keyed samples and source sequence boundaries.
A useful replication contract specifies a source transaction identifier, a commit-order sequence, the schema version used to interpret each event, and the last fully applied source position. If a report requires position S_req, the analytical replica is current for that report only when its complete applied position S_applied satisfies S_applied ≥ S_req for every relevant stream. Separate Kafka partitions cannot necessarily be represented by one scalar watermark: their offsets form a vector, and advancing one component does not prove that other partitions have caught up. Event-time freshness and commit-order completeness are different properties. A two-second ingestion delay can still produce an incorrect historical join if a dimension correction is applied after facts already received an outdated attribute. A reproducible report must identify its reference snapshot or use versioned dimension lookup. Reconciling only total row counts is insufficient; compare sampled business keys, deletes, version boundaries, aggregate checksums, and source commit windows independently.
Unit 2: ClickHouse: History, Installation, and First Steps
ClickHouse originated from the needs of Yandex.Metrica and evolved into an open-source, column-oriented OLAP DBMS. Its versioned features, self-managed distribution, and managed cloud service must be distinguished in architectural decisions. Historical articles are evidence of a feature's introduction, not proof that the implementation is unchanged today.
2.1. Yandex.Metrica, Open-Source Development, and the 2024 Research Paper
The publicly documented historical motivation was high-cardinality, interactive analytics over very large event datasets. The 2024 peer-reviewed paper describes central ClickHouse architectural principles, including storage organization and execution. Read this work alongside current documentation: changes in planning, indexes, caching, and mutations mean release-dependent implementation details require explicit version qualification.
ClickHouse emerged from Yandex.Metrica's need to analyze high-volume event data interactively. Its open-source history is relevant because the original workload shaped the choice of sorted column-oriented parts and fast aggregation rather than OLTP row updates. The peer-reviewed 2024 architecture paper supplies an important primary source for storage and query execution concepts. Historical origin, source license and commercial development should be treated as separate subjects; current capabilities must be verified against the version actually in use rather than inferred from an early presentation.
2.2. Open-Source ClickHouse, Cloud Services, and Licensing
The open-source server is distributed under Apache 2.0; managed ClickHouse Cloud is a paid service with a different operational and feature boundary. Free software does not imply free hardware, administration, backups, network transfer, or support. Licensing claims about documentation and third-party books must not be conflated with the software license.
The Apache 2.0 license of the ClickHouse source distribution does not make every service surrounding it free of charge. A self-hosted installation incurs hardware, administration, storage, backups, monitoring and recovery expenses. A managed cloud offering adds its own commercial conditions and may expose features absent from a particular open-source release. Distinguish source-code license, documentation license, cloud billing, and third-party driver licenses explicitly. Claims of zero cost refer at most to a license-fee category, not to total cost of ownership. Vendor cost comparisons require matched throughput, retention, replication, service levels and operational responsibilities.
2.3. Linux and Windows Clients, Containers, and Distributions
Production deployment commonly uses Linux packages, containers, or managed services. Clients may run on other operating systems without changing the server deployment model. Container volumes must preserve data, metadata, and configuration across restarts. Reproducible deployment documents image versions, storage mounts, resource limits, network endpoints, and supported upgrade paths.
Self-hosted installations can use supported Linux packages, containers or other distribution channels, while command-line clients can run separately from the server. A container image does not erase persistent-data management or host-level resource constraints. Mounts must preserve required storage, logs and configuration across restarts. An ephemeral lab with one process can demonstrate SQL syntax and part layout but cannot validate real shard failover, replicated consistency or regional recovery. Release-specific installation instructions and CPU architecture requirements should be documented in every reproducible exercise.
2.4. Server Processes, Versioning, and Compatibility Policies
Feature availability depends on the server build, settings, table engines, and in some cases Cloud versus OSS. Prefer pinned tested versions and review release notes before upgrades. The presence of a SQL keyword in a newer release does not establish backward compatibility. Schema migrations, replication protocol compatibility, and the rollback route require validation in a test cluster.
A release-dependent capability should be documented with its first supported version, current stability classification, controlling settings, and any deployment restriction. For example, a feature introduced experimentally in one release may later become generally available with changed defaults. A reproducible exercise must therefore record the actual server version and effective settings alongside the SQL. Comparing two releases using a query that is not semantically or algorithmically equivalent can produce an invalid optimization claim. A safe upgrade test includes representative inserts, joins, mutations, and distributed reads, followed by correctness reconciliation.
[41] [42] [46]
Server and client version compatibility affects both protocol features and SQL behavior. A client accepting an option does not prove the remote server recognizes that option, while a new server may expose experimental functions behind settings. Pin versions in benchmarks, keep a reversible upgrade plan and test backup compatibility before a major change. Rolling upgrades in replicated clusters require attention to metadata compatibility and the supported sequence of node restarts. Read release notes for defaults that affect asynchronous insertion, analyzer behavior, updates and security policies.
2.5. Single-Node Laboratory Setup and clickhouse-client
A single-node setup is suitable for learning SQL, parts, and engine behavior but cannot prove distributed fault tolerance. Verify the version and build information before exercises; inspect system tables for engine and disk behavior. Keep a dedicated test database and use disposable data. Commands requiring mutation or privileged settings should never be presented as harmless production diagnostics.
SELECT version();
SELECT name, value FROM system.settings WHERE name IN ('max_threads', 'max_memory_usage');
SELECT name, value FROM system.build_options LIMIT 10;
CREATE DATABASE IF NOT EXISTS olap_lab;
CREATE TABLE IF NOT EXISTS olap_lab.measurements
(
measured_at DateTime64(3, 'UTC'),
device_id UInt32,
reading Float64
)
ENGINE = MergeTree
PARTITION BY toYYYYMM(measured_at)
ORDER BY (device_id, measured_at);
INSERT INTO olap_lab.measurements VALUES
('2026-10-27 10:00:00.000', 1, 3.5),
('2026-10-27 10:00:01.000', 1, 4.5),
('2026-10-27 10:00:00.000', 2, 7.0);
SELECT device_id, count() AS samples, avg(reading) AS mean_reading
FROM olap_lab.measurements
GROUP BY device_id
ORDER BY device_id;A single-node laboratory should define the dataset generator, table DDL, sample inserts, expected row counts and client connection command. Query experiments need explicit time zone, server version and configuration values. The physical data directory must be persistent when restart behavior is being studied. One can inspect parts and marks using system tables after insertion, then change sorting keys in a second table and compare read bytes. This proves the effect of a schema on the chosen workload without conflating it with clustering or network variability.
2.6. Updates, Upgrades, and Configuration Validation
Differentiate upgrading the server executable from UPDATE of table data. Before a server upgrade, record configuration, active engines, cluster topology, backup consistency, and a representative query baseline. Upgrade replicas in a supported order and evaluate mixed-version operation explicitly. Test both correctness and performance regressions, with a documented rollback limitation for changed data formats.
A release upgrade is an operational state transition, not simply replacing a binary. Validate the current configuration with supported tools, retain recoverable backups and verify that the new build reads existing parts and metadata. Changed defaults may affect both query plans and ingestion acknowledgement semantics. Upgrade checks should include access-control rules, client compatibility, background merge backlog, replication queues and the results of a fixed suite of representative queries. A rollback route must respect compatibility constraints; reverting software cannot always undo newly written storage formats or migrations.
2.7. Command-Line and SQL Interfaces
The native client, HTTP interface, and various drivers expose overlapping but not identical operational behavior. Session settings, progress reporting, transport encoding, and error handling differ. SQL should be validated against the intended server version, not merely a generic parser. The query's result semantics are distinct from the client's formatting and row-fetch strategy.
A reproducible client workflow records server version, connected endpoint, authentication context, session settings, query text and expected output schema. Native protocol and HTTP clients may differ in default formats and retry behavior; a successfully executed SQL statement does not prove that an upstream ingestion request was safe to replay. clickhouse-client is suitable for interactive examination and batch scripts, while clickhouse-local processes files without a long-running server. Tools such as clickhouse-format and clickhouse-compressor address formatting and compression rather than database execution. Do not treat a convenient SQL prompt as an alternative to access control, secrets management or query resource limits.
Unit 3: ClickHouse Data Types and Schema Design
Analytical type selection affects numerical correctness, compressed footprint, filtering, grouping, and interoperability. Schema design must preserve source semantics, not merely minimize byte width. Nullable values, evolving structured data, and precision-sensitive calculations require explicit treatment.
3.1. Numeric Types, Decimal, Float, and Overflow Semantics
Choose signedness and width from verified ranges. Floating-point arithmetic can be nonassociative and should not be used as an exact replacement for fixed-point financial values. Decimal scale and overflow behavior must be accounted for in arithmetic and aggregation. Compare large integer accumulators and conversions against source type precision to avoid apparently plausible but incorrect sums.
Integer widths and signedness determine legal value ranges; Decimal scale governs exact fixed-point representation within its precision limits. Floating-point arithmetic is not associative in finite precision, so distributed aggregation order can lead to small result differences even when input values are identical. Narrowing numeric types may improve compression but introduce overflow or truncation. A schema must also define what constitutes a missing value: zero and NULL are not interchangeable. Test boundary values and aggregations before accepting inferred numeric types from external documents.
3.2. String, FixedString, LowCardinality, and Enum
String supports variable-length content; FixedString has fixed-length semantics that may surprise application comparisons. LowCardinality can improve storage and grouping for repetitive values but adds dictionary structures. Enum maps labels to known codes and requires controlled schema evolution. Benchmarks should include both encoded size and runtime dictionary lookup behavior.
String holds variable-length bytes, whereas FixedString uses a fixed-width representation suitable only for specific data requirements. Enum can represent controlled categories but requires careful evolution when categories change. LowCardinality uses dictionary-like techniques that often help repeated values, but its benefit falls when almost every value is unique or dictionary overhead dominates. The semantically correct type should be chosen before tuning compression. In particular, identifier columns should not be silently converted into numerical measurements merely because a digit-only sample happens to fit an integer.
3.3. Date, DateTime, DateTime64, and Time Zones
Timestamp representation must preserve required precision and temporal interpretation. Explicit time zones avoid depending on server or client defaults. Distinguish UTC instants from local civil times and apply daylight-saving rules when grouping by local day. Changing display time zone does not necessarily change the stored instant, but conversion and function behavior must be verified.
Timestamp design needs a declared temporal meaning. DateTime and DateTime64 differ in fractional-second precision; a DateTime64(3) column can represent milliseconds, but the represented instant still depends on parsing and time-zone rules. Store or normalize UTC instants for cross-region event correlation and retain the original offset when it is a business requirement. Reporting by local calendar day introduces daylight-saving transitions: a local day is not always exactly 86,400 seconds. Sorting by event time can facilitate time-window pruning; partitioning by ingestion time may be operationally preferable for late-arriving streams, but combining these choices must be deliberate.
3.4. UUID, IPv4/IPv6, Boolean, and Specialized Types
Typed UUID and IP columns can improve validation and operator expressiveness, but conversion from heterogeneous source strings must be checked. Numeric IP ordering and text formatting differ from lexical string behavior. Booleans have database-specific representation and null semantics. Avoid silently interpreting malformed values as zero or another plausible default during ingestion.
UUID and network address types encode structured identifiers in typed representations. Their physical ordering and equality behavior must be distinguished from a human-readable display string. A random UUID used as the first sort-key component can destroy locality for time-window filtering. IPv4 and IPv6 require explicit treatment when both families appear in a single analytic query, and address normalization rules matter for grouping. Boolean and other specialized types may be represented or coerced differently across drivers; verify how values are serialized through JDBC and HTTP endpoints.
3.5. Array, Tuple, Map, Nested, JSON, and Dynamic/Variant
Structured types represent repeated or heterogeneous fields without always requiring separate rows. Arrays retain element order; maps and tuples have distinct structural semantics. Nested/JSON/Dynamic capabilities and their performance vary by server release. Schema evolution and predicate pushdown may be less predictable than with stable typed columns, so use structured fields only where their flexibility justifies the cost.
[41] [48]
Arrays, tuples, maps and nested structures model different access patterns. A map allows variable keys but may cost more to scan than dedicated typed columns when the same attributes are queried repeatedly. LowCardinality(String) helps repeated values by dictionary-like representation; it is not a universal replacement for String when values are nearly unique. JSON-related types and Dynamic/Variant facilities have version-specific restrictions that require explicit feature checks. For a large event payload, frequently filtered attributes should have stable types and explicit columns, while seldom-used optional attributes can remain nested. Test serialization, missing-key semantics and type evolution against actual input documents; schema flexibility should not obscure data quality failures.
A nested schema can preserve rich event structures, but query patterns should determine whether an attribute is materialized as a typed column. For instance, a field repeatedly used in GROUP BY should not require parsing the same JSON payload for every row if its type and semantics are stable. A Map with arbitrary keys supports flexible input while making key-specific operations and compression less predictable; an Array stores ordered elements that may expand the logical row count through arrayJoin. A Tuple has fixed typed positions and different evolution constraints. Null, absent key, empty array, and zero-valued element must remain distinct when business semantics require them. Schema-on-read convenience is not a substitute for input validation and provenance. Mixed versions of JSON documents should be decoded under explicit compatibility rules, especially during backfill.
3.6. Nullable Costs and NULL Semantics
Nullable(T) carries a null bitmap or equivalent state in addition to values, and aggregate functions have defined behavior around null inputs. NULL is not interchangeable with an empty string, zero, or missing event. Nullable grouping keys and joins require careful comparison semantics. Measure null fractions and avoid introducing nullable wrappers for fields whose source contract forbids absence.
SQL aggregates commonly ignore NULL inputs for specified functions, but the handling of an all-NULL group, a missing key, and a legitimate zero are distinct. For example, a record with a missing duration should not automatically contribute zero milliseconds to an average. If 90 observations have duration 100 and 10 are missing, the correct observed-data average is 100, while interpreting missing as zero yields 90. Explicit use of defaults must therefore represent a business decision, not merely avoid a Nullable storage cost. Type selection should preserve source semantics through CDC and serialization.
Nullable columns carry an additional representation for missing values and may impose extra decoding and filtering work. NULL does not mean empty string, zero or an unknown identifier unless the data contract explicitly equates them. In SQL three-valued logic, predicates involving NULL require careful interpretation, especially with JOIN and GROUP BY. A metric that replaces missing durations with zero changes its average. Assess null frequency and business meaning before using ifNull, coalesce-like functions or default values in ingestion transformations.
3.7. Defaults, Materialized Columns, Aliases, Codecs, and Constraints
Default expressions affect rows inserted without a value; materialized expressions derive stored values, while aliases expose computed views without necessarily storing a separate column. Compression codecs affect physical representation, not logical type. Constraints should not be assumed equivalent to foreign keys or general OLTP uniqueness enforcement. Track schema changes and the effect on existing parts.
DEFAULT expressions, materialized columns and alias expressions have distinct storage and evaluation semantics. A computed field evaluated during insertion may remain fixed even if its upstream meaning changes, whereas a query-time alias depends on the current expression and available columns. Constraints do not necessarily provide the full transactional invariant enforcement familiar from general-purpose OLTP systems. Changes to materialized expressions and codecs may not retroactively rewrite all historical parts. Record schema revisions and validate older data after a DDL migration.
3.8. Schema Inference and Schema Evolution
Inferred column types depend on samples, formats, and parser settings. A successful sample parse is not proof that historical extremes or unusual null patterns are supported. Explicit target schemas are preferable for critical pipelines. For evolution, test the compatibility of new column definitions with old data, source CDC schemas, and downstream queries.
SELECT
    toTypeName(toDateTime64('2026-10-27 12:00:00', 3, 'UTC')) AS timestamp_type,
    toTypeName(toUInt32(42)) AS id_type,
    toTypeName(toDecimal64(12.50, 2)) AS amount_type;
Schema evolution must preserve historical interpretation rather than merely permit parsing the next batch. Adding a computed or indexed column may require explicit materialization to populate older parts; a new definition does not guarantee that existing storage contains the derived representation. A changed dimension encoding, timestamp precision or default value can silently change grouping results. Treat upstream changes as versioned contracts: test a small sample, stage DDL changes, and compare query results across schema revisions. Backfilling a derived field on a large table entails read/write and merge costs, even when the DDL statement itself finishes quickly.
For migration validation, create a controlled table containing rows inserted before and after the schema change and compare the visible values of defaulted, materialized and aliased columns. A metadata-only column addition may expose a new logical value to readers without rewriting historical compressed streams. Conversely, materializing an expression or secondary index can require scanning substantial historical parts and writing additional data. Estimate this deferred cost from affected compressed bytes and available background capacity. Distinguish an online schema change that is syntactically accepted from the later physical convergence of all stored parts.
Unit 4: ClickHouse SQL and Fundamental Database Operations
ClickHouse SQL offers extensive analytical functions but is a dialect with settings- and version-dependent behavior. Portability requires semantic tests, not only parser acceptance. SQL examples must use real columns from their declared test tables, and results should be independently checkable.
4.1. DDL: CREATE, ALTER, DROP, and RENAME
DDL defines tables, engines, keys, and metadata operations. Some ALTER forms trigger background mutations while others modify metadata. A DROP statement can remove persistent data or metadata and must never be included in a supposedly read-only diagnostic script. Distinguish cluster-wide DDL coordination from successful execution on an individual node.
DDL operations modify schema and metadata, but their effects can involve background rewriting or distributed propagation. ALTER adding a column is not necessarily a physical rewrite of every old part, while changes to materialized expressions or indexes may need explicit backfilling. DROP must be treated as a potentially destructive operation with replication and backup consequences. Use versioned schema migrations and record expected before/after system-table state. A command accepted at the coordinator is not always evidence that a distributed DDL action has finished on every shard.
4.2. SELECT, WHERE, PREWHERE, ORDER BY, and LIMIT
WHERE filters logically, while PREWHERE can influence which columns are read early. ORDER BY on a query specifies result ordering and is separate from the table's storage sort expression. LIMIT without a deterministic result ordering need not select identical records across runs or shards. Benchmark filters with the corresponding read-row and read-byte counters.
CREATE TABLE events
(
    event_id UUID,
    service_id UInt32,
    event_type LowCardinality(String),
    event_time DateTime64(3, 'UTC'),
    ingested_at DateTime64(3, 'UTC'),
    status_code UInt16,
    duration_ms UInt32,
    bytes_sent UInt64,
    message String
)
ENGINE = MergeTree
PARTITION BY toYYYYMM(event_time)
ORDER BY (service_id, event_time, event_id)
TTL event_time + INTERVAL 365 DAY DELETE;
SELECT event_time, event_id, service_id, status_code
FROM events
WHERE service_id = 42
ORDER BY event_time, event_id
LIMIT 25 AFTER status_code >= 500 UNTIL status_code < 500;[38]
WHERE filters rows logically; PREWHERE can move eligible filtering into an earlier column-read phase to reduce unnecessary decoding. ORDER BY in a SELECT defines result ordering and should not be confused with table-level physical sort order. LIMIT without deterministic ordering may return different subsets as parallel execution and part merging change. Predicate placement and expression types influence whether the sparse primary index or data-skipping indexes can prune granules. Use EXPLAIN and measured read bytes to establish physical benefit rather than assuming one clause is always faster.
4.3. INSERT SELECT, VALUES, and Data-Format Syntax
INSERT ... VALUES and INSERT ... SELECT have different ingestion and execution paths. Structured formats such as JSONEachRow and Parquet have their own type conversion and framing rules. Batch size, asynchronous acknowledgment, materialized-view processing, and deduplication all affect correctness and throughput. Verify row counts and the accepted-versus-committed boundary independently.
INSERT INTO events
    (event_id, service_id, event_type, event_time, ingested_at,
     status_code, duration_ms, bytes_sent, message)
VALUES
    (generateUUIDv4(), 42, 'REQUEST', toDateTime64('2026-10-27 12:00:00', 3, 'UTC'), now64(3), 200, 42, 4096, 'completed'),
    (generateUUIDv4(), 42, 'ERROR',   toDateTime64('2026-10-27 12:01:00', 3, 'UTC'), now64(3), 503, 900, 0, 'timeout'),
    (generateUUIDv4(), 42, 'REQUEST', toDateTime64('2026-10-27 12:02:00', 3, 'UTC'), now64(3), 200, 37, 2048, 'recovered');
[7] [8]
INSERT ... VALUES expresses typed row construction, INSERT ... SELECT transfers query results, and format-based inserts parse external representations. The parser and type-conversion path may differ significantly in CPU cost across formats. In a bulk load, prefer a bounded batch size large enough to avoid excessive part creation while retaining acceptable memory and latency. Idempotent replays require stable event identity; merely rerunning an INSERT SELECT can double-count facts. Include row-count reconciliation and format validation as part of any loading script.
4.4. DISTINCT, SAMPLE, UNION, INTERSECT, and EXCEPT
Set operators combine or compare row sets according to their duplicate-handling semantics. DISTINCT can require memory proportional to unique tuples; disk spilling may apply in supported versions and configurations. Sampling has storage and query-specific semantics, not an automatic guarantee of a statistically unbiased sample for every grouped report.
DISTINCT, SAMPLE, UNION, INTERSECT and EXCEPT solve different relational problems. Exact distinct may maintain substantial state proportional to unique keys; approximate distinct aggregators may be suitable for metrics but are not drop-in equivalents for returning distinct rows. SAMPLE depends on the table's sampling expression and physical organization; a syntactically valid sample clause does not imply uniform random selection of independent events. Set operators must be interpreted with respect to duplicate preservation and type coercion. Validate SQL semantics with small constructed tables including nulls, duplicate rows and incompatible types before extrapolating behavior to large production data.
4.5. CTE, WITH, Aliases, and Subqueries
Common table expressions improve composability but should not automatically be assumed to materialize a temporary result. The optimizer may inline, share, or alter evaluation depending on version and query construct. Alias resolution and scope can differ from other SQL systems. Use EXPLAIN and deterministic test data to establish the actual plan and repeated-expression cost.
A common table expression may be expanded at multiple use sites, potentially repeating an expensive subquery. Some releases and SQL constructs introduce explicit materialization options, but their availability and guarantees must not be assumed from the keyword WITH. If two uses of a CTE depend on a nondeterministic expression or a changing source, evaluating them separately can affect semantics as well as performance. A reliable rewrite compares final result rows, checks the execution plan, and measures repeated execution under a stable test dataset.
[41]
A common table expression is a logical query construct, not an unconditional guarantee that its result is materialized once. If the same expression is referenced repeatedly, whether it is expanded or materialized depends on supported language features, analyzer behavior and server version. Non-deterministic functions can therefore produce unexpected results when a CTE is re-evaluated. A subquery used with IN can allocate a large right-hand set; spilling or limits depend on the release and settings. EXPLAIN is necessary to establish actual physical execution rather than inferring it from a visually compact SQL statement.
4.6. SQL Standard and ClickHouse Dialect Differences
ClickHouse supports SQL extensively but does not promise complete interchangeability with every ANSI SQL feature or another vendor dialect. Compare null semantics, integer division, join behavior, aggregation naming, casting, and transaction support. Some compatibility settings change results and should be recorded alongside the query. Ported workloads require both syntax and result-equivalence tests.
[41]
ClickHouse SQL is broad but should not be described as complete, unconditional conformance to every SQL standard feature. Transaction statements, mutation syntax, joins, NULL handling and type coercions can differ from Oracle or PostgreSQL. When porting a query, verify the result on a constructed dataset with duplicates, nulls and boundary timestamps. A parser accepting common SQL text does not imply identical isolation or locking behavior. Identify the dialect and server version in examples involving advanced features or settings.
Unit 5: Inserting and Bulk Ingesting Data
Batch size affects the number of physical parts. Many tiny inserts create more metadata and more background merge work for the same logical data volume.
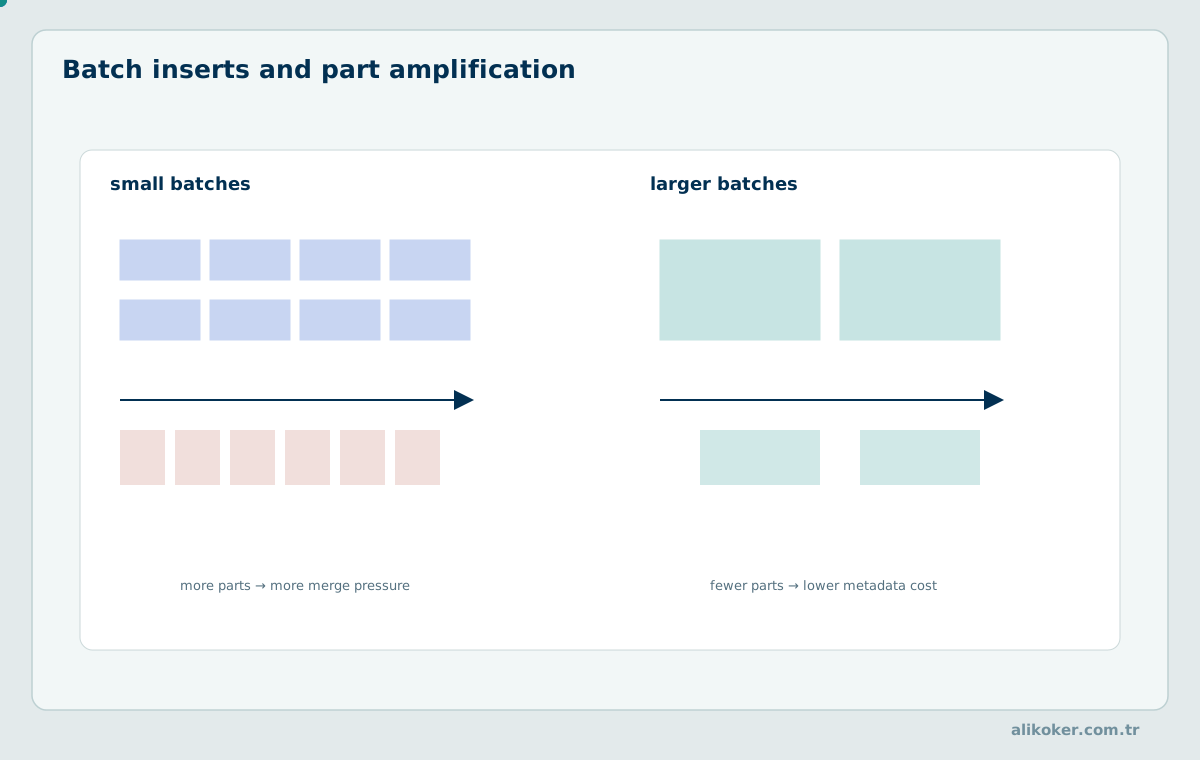
High-throughput ingestion must balance buffering, persistence acknowledgment, small-part generation, deduplication, and downstream materialized processing. Exactly-once end-to-end behavior cannot be inferred from any one queue or database feature; it must be constructed from source identity and the relevant failure boundaries.
5.1. Batch INSERT, Batch Size, and Part Costs
Many tiny insertion batches create too many parts, especially when each batch spans numerous partitions. Larger batches amortize sorting, part metadata, and compression overhead but consume more client/server memory and increase individual acknowledgment latency. Determine batch policy from arrival rate, latency target, average row size, and merge capacity. Monitor actual parts created per inserted row.
Batch size influences not only immediate INSERT throughput but also the number of immutable parts generated for later merging. Very small batches may produce many files and backlog; extremely large batches can increase memory, latency and retry cost. In concurrent systems, asynchronous buffering can combine several requests into fewer physical writes when configured appropriately. Evaluate successful stable-row ingestion together with part creation rate and downstream view completion, rather than quoting HTTP request acceptance throughput alone.
5.2. CSV, JSONEachRow, Parquet, Arrow, and Framing
Row-oriented CSV and JSONEachRow have different parsing, escaping, and schema costs from columnar Parquet or Arrow. Transport framing must delimit records and blocks correctly, especially for streaming HTTP clients. A file's declared schema may differ from inferred or evolved logical types. Record malformed-input policy and avoid silent truncation or default substitution.
CSV and JSONEachRow parse row-oriented text; Parquet and Arrow use columnar or structured binary representations with different compression and typing behavior. Framing matters during streaming: a truncated JSON line can be detected differently from an incomplete binary message. CSV inference may misclassify leading zeros, nulls and scientific notation. Evaluate parser CPU, bytes on the network, input schema fidelity and retry boundaries under actual row distributions. The fastest format in a synthetic benchmark may be inappropriate if its type mapping loses required precision.
5.3. Schema Inference and Data Format Validation
Inference from early rows can misclassify a column whose later values use larger integer ranges or have nulls. Validate representative extremes, timezone values, nested structures, Unicode, and malformed records. Critical pipelines should prefer an explicit schema contract with reject/dead-letter behavior appropriate to the system's safety requirements.
Sampling a handful of JSON records can miss optional fields or later values that exceed the inferred numeric width. A nullable field that is absent in the first batch may unexpectedly appear after millions of rows. Build an explicit schema or validate inferred types against a representative multi-period sample. Reject or quarantine malformed rows according to a documented policy, recording source offsets or file identities so the failed interval can be repaired. A successful import does not establish that every field retained its original meaning.
5.4. Synchronous and Asynchronous Inserts
Synchronous inserts and asynchronous inserts differ in buffering and acknowledgment semantics. A client response may reflect acceptance into a server-managed buffer rather than the same persistence boundary expected for synchronous insertion, depending on settings and version. Newer releases changed default behavior in particular configurations. Explicitly test failures before acknowledgment, flush, and materialized-view processing.
SET async_insert = 1;
SET wait_for_async_insert = 1;
Synchronous insertion and asynchronous insertion have different acknowledgment boundaries. For synchronous insertion, success ordinarily describes the server-side processing of the submitted batch under the configured durability and replication rules. With asynchronous insertion, the request may first enter an in-memory server buffer; actual part creation and materialized-view processing can occur later. The consequences of a process failure depend on the acknowledgment configuration, buffering implementation, and replication topology. Therefore, wait_for_async_insert and relevant deduplication settings are part of the application's data-loss and retry contract, not simply throughput tuning. Server-side batch coalescing can substantially reduce small-part creation during many concurrent inserts, but it also changes visibility latency and resource concentration at flush time. A producer must distinguish “request accepted” from “data durably visible in the desired downstream view.” Test failures between acceptance, flush, and downstream view processing rather than inferring behavior from a successful response on an idle server.
Consider 1000 producers each sending an insert of ten events once per second. Without appropriate batching, the server may need to organize a very large number of tiny parts, imposing metadata and background merge overhead disproportionate to total bytes. Buffering requests asynchronously can group them into larger physical writes; however, the flush interval creates an additional window before final storage. If a client receives an acknowledgment before flush, failure within that interval has different consequences from an acknowledgment that waits for data processing. The setting and exact release behavior must be tested, not guessed.
A robust producer sends stable event identities, uses bounded retries, and treats a network timeout as an ambiguous completion state. The target should expose enough applied information to reconcile the batch. With dependent materialized views, durable source visibility does not automatically prove that every derived destination is consistent at the same instant. Test a restart at each acknowledgment boundary and inspect both the source fact rows and their aggregate contributions. Performance reports should include p99 insert latency, part creation rate and downstream data freshness, not just average request acceptance time.
5.5. Deduplication and Idempotence of Repeated Inserts
Network timeouts leave clients uncertain whether a batch was committed. Retrying blindly can duplicate events unless the destination or pipeline recognizes stable retry identities. Block-level insert deduplication is not the same as row-level business-key uniqueness. Design a deterministic source ID, retry key, or version model and test ambiguous success cases.
A retry is safe only when the target can recognize it as the same logical event or the operation is naturally idempotent. Identical bytes do not necessarily mean the same logical input when batch boundaries, order or source identifiers change. Block-level deduplication covers a particular physical insertion case, not arbitrary CDC replay. Preserve stable source keys and ordering metadata so that duplicate updates or deletes can be resolved consistently. Test failures immediately after target write and before offset acknowledgment to expose the most common replay ambiguity.
5.6. Streaming versus Batch Ingestion Capacity
Batch ingestion maximizes amortization while streaming reduces freshness delay. A hybrid pipeline may microbatch arriving messages but perform large historical backfills separately. Evaluate the arrival burst distribution and processing headroom, not just average daily volume. During backlog recovery, database merges and query traffic must remain within resource budgets.
[46]
Capacity planning must account for both mean and burst arrival rates. If producers generate R events/s of average encoded size s, the ingress network receives roughly R·s bytes/s before protocol and replication overhead. Compression can reduce persisted bytes without eliminating parsing and transformation CPU. The number of part-creation operations may be more restrictive than byte throughput for very small batches. Queue stability requires sustained service capacity to exceed long-run arrivals; a backlog accumulated during an outage must then be drained while live traffic continues. Specify acceptable catch-up time and the resource reserve for it. Pipeline freshness is measured at the final analytical table or report, not at an intermediate broker alone.
Unit 6: OLAP Theory and Multidimensional Data Analysis
OLAP operations read the same data at different levels of detail. Roll-up, drill-down and slice/dice make dimensional hierarchies operational.
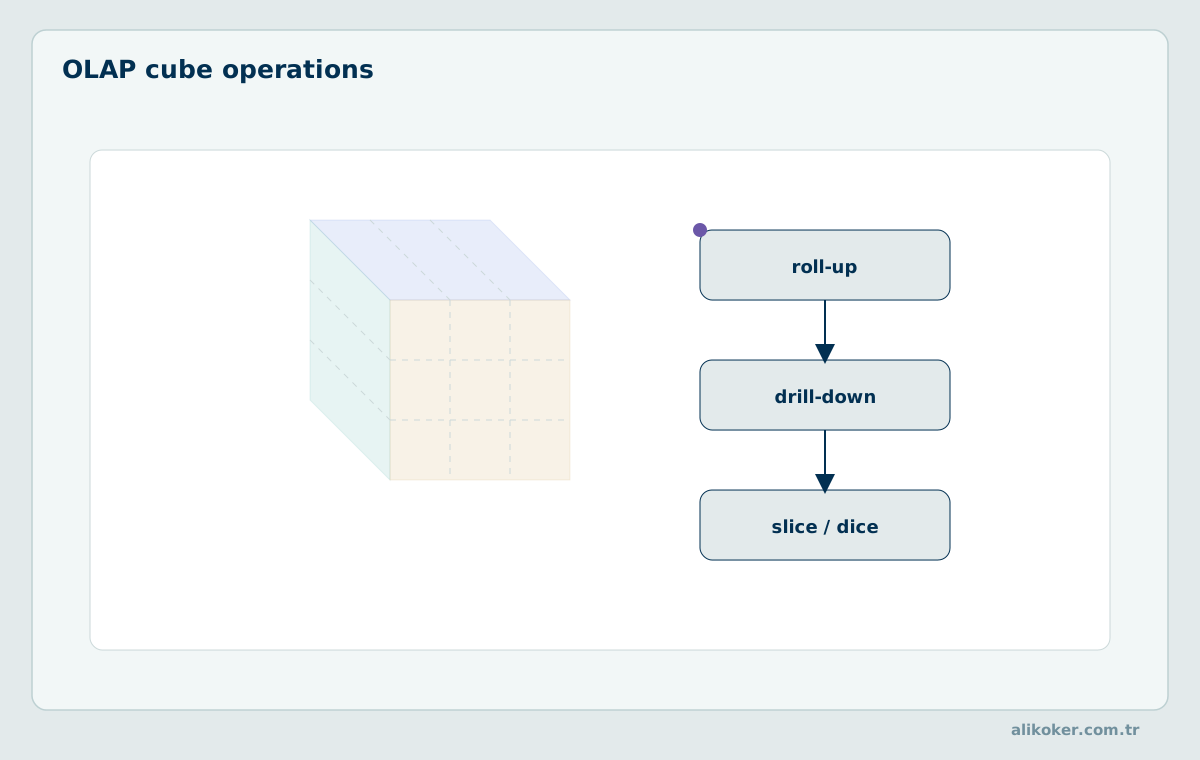
Multidimensional analysis organizes facts, measures, dimensions, and hierarchies to permit aggregation across combinations of attributes. The mathematical type of an aggregate determines whether partial results can be merged, which in turn determines whether distributed and precomputed execution is exact.
6.1. Facts, Measures, Dimensions, and Dimensional Hierarchies
The fact grain defines what one row represents: an event, an order line, or a periodic account balance. Measures are numeric observations or derived states; dimensions provide context such as time, organization, or geography. Time hierarchies must account for time zones and calendar rules. A mismatch between declared grain and grouping logic causes double counting irrespective of storage engine performance.
A fact table must declare one stable grain: for example, an HTTP request, an order line or a five-minute service observation. Measures derived at different grains cannot automatically be joined or summed without double counting. Dimension hierarchies are also data contracts; a service may change organization over time, making a naïve current-state join historically misleading. Time dimensions must specify time zone and business-calendar assumptions. Surrogate keys can identify dimension versions independently of mutable natural identifiers. When validating dimensional models, check key uniqueness at the intended grain and ensure each fact has a defined relationship to the appropriate dimension version.
6.2. Additive, Semi-Additive, and Non-Additive Measures
Event counts and amounts are usually additive over independent partitions. An account balance can be additive across accounts but not across successive dates; it is semi-additive. A ratio, percentile, or distinct-user count is generally non-additive. Instead of averaging subgroup averages, merge the pair (sum,count); instead of summing subgroup distinct counts, use appropriate set or sketch semantics. Data type and grouping grain remain part of the correctness argument.
Worked aggregation: two partitions have event sums of 100 and 300, with 10 and 30 observations, respectively. Their arithmetic means are 10 and 10, but this equality is incidental. For sums of 100 and 100 with 10 and 30 observations, the global mean is 200/40 = 5, whereas the unweighted mean of partition means is (10 + 3.333…)/2 ≈ 6.667. The correct partial state is a pair (sum, count). A distinct count requires either an exact mergeable set or a documented approximate sketch; summing distinct-user counts across partitions fails when users appear in both.
An aggregate is distributive when partial results can be combined using the same operation; SUM and COUNT exhibit this property over disjoint inputs. AVG is algebraic rather than directly distributive: retain the pair (sum,count), not a scalar average. With nine observations averaging 10 and one observation averaging 40, the overall average is (9·10 + 1·40)/10 = 13, not 25. Error rates likewise require merging error counts and request counts before division; averaging regional percentages without their traffic weights is invalid. An account balance can be additive over accounts but non-additive across reporting dates. A distinct count cannot generally be combined by adding partial counts because |A∪B| = |A| + |B| − |A∩B|. AggregatingMergeTree can preserve avgState, uniqState and other mergeable aggregate states; query-level …Merge functions produce aggregate results. Exact distinct counting has a potentially substantial memory footprint, while sketches exchange accuracy for bounded space. For medians and percentiles, storing final percentile scalars discards information required to combine arbitrary partitions; preserve supported intermediate states instead.
For a ratio r = x/y, partial ratios do not form a mergeable sufficient statistic unless the denominators are equivalent and the use case permits equal weighting. Store numerator and denominator separately. If group A has 1 error in 10 requests and group B has 10 errors in 1000 requests, the unweighted average of 10% and 1% is 5.5%, whereas the correct overall rate is 11/1010 ≈ 1.09%. The same principle applies to weighted latency averages and aggregate measures that differ by dimension grain. A fact model designed without this algebraic distinction can produce wrong answers even when the database engine executes every SQL expression exactly as written.
6.3. OLAP Operations: Roll-Up, Drill-Down, Slice, Dice, and Pivot
Roll-up moves to coarser dimensions; drill-down increases detail; slice fixes a dimension value; dice restricts several dimensions; pivot changes the dimensions presented as axes. These are logical operations, not separate storage engines. Rolling up a non-additive measure such as a percentile requires retaining a mergeable state or recomputing it from the underlying distribution.
Roll-up aggregates along a declared hierarchy, while drill-down reveals a finer level of detail. Slice fixes a dimension value, dice selects a multidimensional subspace, and pivot changes the presentation axes without necessarily changing underlying facts. These operations should preserve the algebraic validity of the measure being aggregated. Summing an event count across dates is generally valid over disjoint periods; summing an account balance over reporting dates usually is not. A pivoted report must not silently merge distinct entities because a display label was substituted for a stable key.
6.4. CUBE, ROLLUP, GROUPING SETS, and Relational Algebra
GROUP BY ROLLUP generates hierarchical subtotals and CUBE generates combinations of grouping dimensions. GROUPING SETS explicitly selects required aggregation levels, often avoiding an exponential number of irrelevant combinations. Distinguish subtotal placeholders from genuine missing dimensions by grouping metadata rather than treating all NULL-like output values as equivalent.
Suppose a reporting query groups by year, month, and region. A full cube can produce 2³ = 8 grouping combinations before considering the detailed value ranges; a roll-up based on the ordering of dimensions produces a narrower hierarchy. The physical row count of a materialized cube can be much larger than the raw number of distinct region/month combinations because subtotals create additional keys. GROUPING metadata is therefore necessary to distinguish an omitted subtotal dimension from an actual NULL in source data. In high-cardinality settings, explicitly chosen grouping sets may be less costly than materializing all combinations. This decision is about required query algebra rather than database-engine naming.
SELECT
    service_id,
    toDate(event_time) AS event_day,
    GROUPING(service_id, event_day) AS grouping_id,
    count() AS event_count
FROM events
WHERE event_time >= toDateTime64('2026-10-01 00:00:00', 3, 'UTC')
  AND event_time < toDateTime64('2026-11-01 00:00:00', 3, 'UTC')
GROUP BY ROLLUP (service_id, event_day)
ORDER BY grouping_id, service_id, event_day;
[1] [2]
An OLAP cube is a collection of grouping sets, not necessarily a single dense physical array. For k independent dimensions, the power set contains 2ᵏ possible grouping sets; their resulting row count is the sum of the distinct key combinations within each set. ROLLUP(a,b,c) produces (a,b,c), (a,b), (a), and (); CUBE(a,b,c) generates eight groupings, while explicit GROUPING SETS limits work to selected combinations. Distinguishing an actual zero-valued key from an aggregate subtotal is important because missing grouping keys can be represented by type defaults under ClickHouse settings. The GROUPING indicator expresses whether a column participates in the grouping level. A 12-dimensional full cube contains 4096 grouping sets before considering the cardinality within each set. Precomputing all of them without workload evidence may shift a query-time cost into unsustainable write amplification and storage.
6.5. ROLAP, MOLAP, HOLAP, and Cube Models
ROLAP computes multidimensional relationships through relational tables and queries. MOLAP uses structures optimized around precomputed cubes; HOLAP combines detail storage and partial cube materialization. Compare update cost, dimensional sparsity, cube explosion, and query flexibility before selecting a model. ClickHouse typically implements relational analytical queries with selectively materialized aggregates rather than requiring a dense multidimensional cube.
ROLAP computes aggregates over relational data and typically benefits from indexing and optimizer capabilities. MOLAP precomputes cube-like summaries, trading update cost and storage for low-latency dimensional access. HOLAP combines detail-level relational storage with selected multidimensional summaries. These categories describe physical strategies, not mutually exclusive commercial products. A ClickHouse deployment may use raw MergeTree facts plus materialized aggregate states, thereby exhibiting features associated with more than one category. The choice depends on dimensional sparsity, update frequency, refresh requirements and how often analysts change the set of grouped dimensions.
6.6. Cube Materialization and Precomputation Costs
Precomputing aggregates converts repeated query work into additional ingest, storage, and maintenance costs. If k independent dimensions are fully cubed, the number of grouping combinations can reach 2ᵏ. Real designs materialize only queries whose saved execution cost exceeds their incremental update and storage costs. The cost model should include late events and corrections, not only ideal append-only arrival.
A cube materialization decision is a constrained optimization problem. The benefit is the aggregate query work avoided for frequently requested dimension combinations; the cost includes additional bytes, transformation CPU per inserted batch, read amplification during merges, and correction handling for late data. Let qᵢ be query frequency, T_rawᵢ its raw-table cost, T_matᵢ its precomputed cost, and C_update the maintenance cost across the same interval. A proposed materialization is attractive only if Σᵢ qᵢ(T_rawᵢ−T_matᵢ) exceeds the combined maintenance, storage, and correction costs at the chosen service level. Different grouping sets may share states, but refreshing a derived result after an historical correction is not always equivalent to adding a new partial aggregate. Late deletions require inverse states, explicit recomputation, or version-aware replacements according to the operator.
Unit 7: Analytical Data Modeling and Data Warehouses
A schema optimized for transactional normalization is rarely optimal for every analytical workload. Modeling begins with business grain and update semantics, then chooses dimensions, physical sort order, partitioning, and optional summaries. Logical model, physical model, and ingestion contract must remain distinct.
7.1. Fact Granularity and Surrogate-Key Strategies
State the exact event represented by one fact row before selecting keys. Surrogate dimension identifiers decouple analytical history from mutable business identifiers. In an append-only source, uniqueness may be enforced upstream or during query-time version selection rather than through a MergeTree primary-key uniqueness constraint. Design deduplication around source identity, commit sequence, and version semantics.
Fact granularity defines the uniqueness of an observation independently of database primary-key syntax. An order line can appear in several status events, so order ID alone may not identify one fact row. Surrogate dimension keys support slowly changing versions, but the source event ID and commit sequence should remain available for replay and reconciliation. If two source records share the same business identifier, decide whether they are duplicates, separate events or versions. ClickHouse's sparse primary index does not enforce logical uniqueness. Preserve an explicit identity and versioning policy even when the serving schema is optimized for analytic grouping.
7.2. Star and Snowflake Schemas
A star schema has a central fact table and comparatively denormalized dimensions; a snowflake normalizes dimension hierarchies into additional relations. A star often reduces join complexity and improves predictable reporting, but a very wide dimension can increase storage and change propagation. ClickHouse can support either model; its optimal join strategy depends on table sizes, key cardinalities, sort order, and data freshness.
A star schema connects one or more fact tables directly to descriptive dimensions; a snowflake schema normalizes some dimension attributes into additional related tables. Normalization can reduce duplication and simplify updates, while denormalization can reduce runtime join cost for frequently queried attributes. ClickHouse favors a physical representation chosen for the observed query workload, but this does not invalidate the logical benefits of governed dimension identities. Maintain a distinction between the conceptual model and the physical serving layout. Test the consequences of dimension changes and late corrections before copying descriptive fields into immutable events.
7.3. Denormalization and Dimension Tables
Denormalization avoids repeated joins but duplicates dimension attributes into facts. This can be advantageous for immutable high-volume events and frequently accessed dimensions, provided corrections are rare or explicitly modeled. External dictionaries can offer key-based enrichment without full joins. The cost decision must include ingest transformations, stale dimension values, and the operational work required to replay historical facts.
Denormalization trades fewer joins for repeated attributes and correction costs. It is beneficial when reference fields change rarely and repeated analytical requests otherwise require expensive distributed lookups. It can be harmful when a dimension attribute is corrected retroactively and millions of already-enriched fact rows must be revised. Keep a stable normalized source of reference data and document which attributes are cached, copied at event time or resolved at query time. Source-of-truth definitions remain business contracts, not simply storage-engine settings.
7.4. Slowly Changing Dimensions Types 1, 2, and 3
Type 1 overwrites an attribute and discards its previous value; Type 2 records time-bounded versions; Type 3 retains a limited prior value. An event should join against the dimension version valid at its event time when historical attribution is required. Valid-time boundaries must be nonoverlapping, and out-of-order corrections require deterministic conflict handling. Ingestion time and business-effective time are not interchangeable.
Consider a customer whose organization changes on 1 June. Under Type 1 handling, earlier events appear associated with the new organization after an update; under Type 2, the original organization remains valid for the historical interval. To attribute events as they would have been classified at occurrence time, join against a nonoverlapping validity interval that contains the event timestamp. Corrections entered late should update the business-valid interval rather than silently applying processing time. When using append-only data, represent corrections as new versions with explicit authority and ensure that the lookup resolves the proper version deterministically.
Slowly changing dimensions must be evaluated against the business meaning of historical reports. Type 1 overwrites an attribute and therefore interprets older facts using the current dimension value. Type 2 stores validity intervals; a fact with event time t selects the dimension version satisfying valid_from ≤ t < valid_to. Half-open intervals avoid assigning boundary events to two versions. Type 3 retains a limited number of previous attribute values and is not an unrestricted history. When a correction is recorded today but becomes effective last month, valid time and system-recorded time differ. A bitemporal model preserves both and permits reconstruction of what was known at an earlier reporting date. If dimensions are denormalized into facts, a retroactive correction may require repairing fact records and materialized aggregates, not merely updating one dimension row. Check for overlapping Type 2 intervals, missing dimension versions, and invalid open-ended ranges before constructing ASOF or interval joins.
A bitemporal dimension represents both business-valid time and system-recorded time. A historical report run on 1 October can therefore be reconstructed even if a correction recorded on 15 October changes the effective customer classification for September. A simple valid-time lookup answers “what classification was effective then,” while the additional system-time dimension answers “what classification was known at the previous report date.” These are distinct analytical requirements. Historical corrections should trigger reconciliation of any cached or preaggregated results whose grouping keys depend on the changed dimension.
7.5. Event Time, Ingestion Time, and Processing Time
Event time describes when an occurrence happened, ingestion time when the platform received it, and processing time when a stage handled it. Network delay and retries can reorder these clocks. Partitioning exclusively by ingestion time may simplify late arrival but complicate event-time retention and historical scans. A design can retain multiple timestamps and choose query ordering independently from retention policy.
Event time identifies when an observation occurred; ingestion time identifies when it entered an intermediary or analytical system; processing time identifies when a specific transformation executed. These times need not be monotonic relative to one another. A delayed mobile device event can arrive days after its event timestamp, and a replay can give old events new ingestion timestamps. Choose partition and retention expressions based on their intended operational meaning. Freshness dashboards should display the source commit or event watermark explicitly instead of equating the maximum event timestamp with complete delivery.
7.6. Late Data, Reprocessing, and Data Quality
Late events change aggregates that appeared complete. Specify how much lateness is expected, whether aggregates are corrected by replay or versioned state, and how duplicates are recognized. Row counts and checksums are useful but insufficient reconciliation: compare business keys, event versions, temporal ranges, null distributions, and selected aggregate invariants at the same source boundary.
Late records are not necessarily erroneous records. A correctness policy should specify an allowed lateness window, the treatment of updates that arrive outside it and the storage retained for recomputation. Deduplication keys must survive restarts and batch reshaping. If a materialized daily aggregate receives a late correction to yesterday, appending its scalar amount can double count unless the correction has an inverse operation or the day is recomputed. Data-quality checks should separately address malformed types, missing dimensions, overlapping version intervals and out-of-order commits.
7.7. Warehouse, Lakehouse, and Data Pipeline Architectures
Warehouses centralize managed analytical tables; lakehouse architectures attach table metadata and transactional conventions to object-store files. A pipeline may combine CDC, Kafka, structured files, and ClickHouse ingestion. Include schema evolution, consistency of snapshots, object listing behavior, and failure recovery in the architecture. Separating storage and computation does not eliminate network, metadata, or correctness costs.
A conventional data warehouse imposes a governed schema on loaded records; a data lake generally separates low-cost object storage from engines that read open file formats. A lakehouse introduces table metadata, snapshots and change management over files. These are architectural patterns rather than promises about data correctness. A CDC-backed ClickHouse warehouse has its own persistence and indexing model; its source files and event offsets should still be recorded for replay. Separate raw, curated and serving layers can simplify investigations when a transformation changes. In every architecture, specify when a record becomes visible, how its schema is validated, and which durable log permits rebuilding an aggregate. An object-store snapshot cannot by itself prove that a downstream ClickHouse query includes a matching source transaction boundary.
Unit 8: Column-Oriented Storage and Data Compression
The central benefit of columnar storage is avoiding columns that a query never references. Adjacent values with similar distributions also compress efficiently.
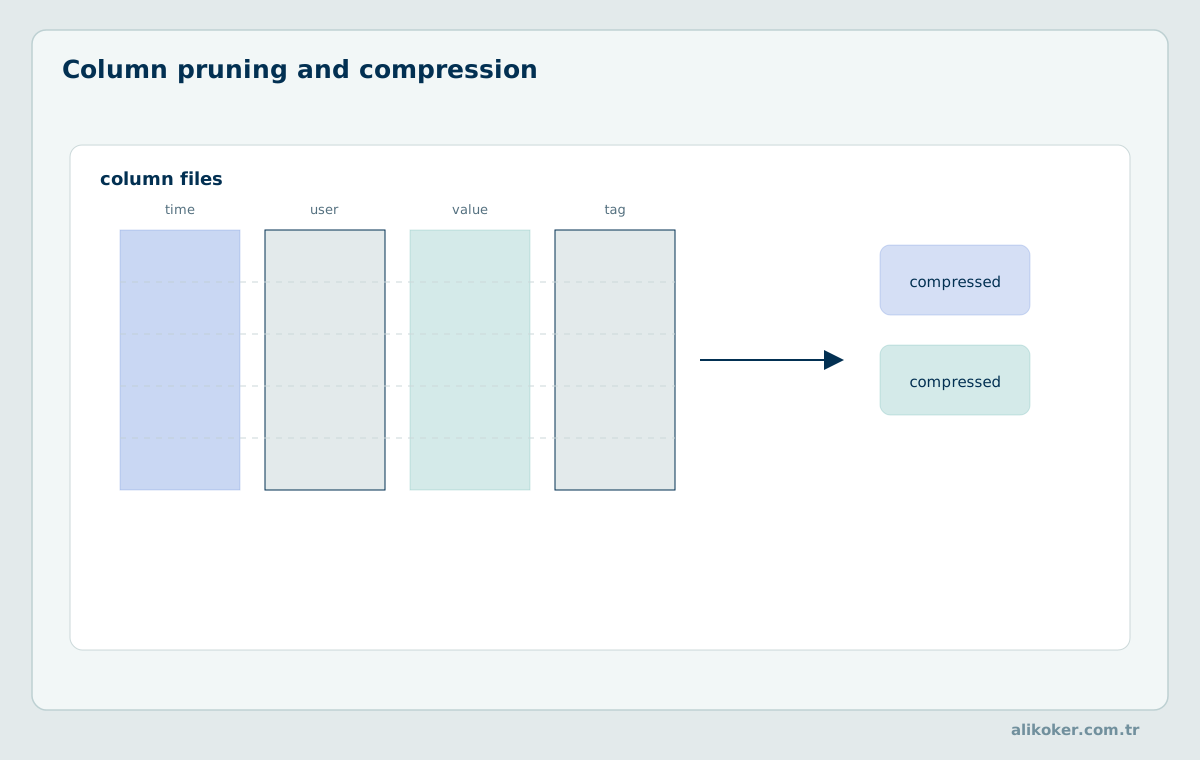
Column encoding and compression change the amount of data that must be transferred and the amount of CPU work needed to decode it. The smallest compressed representation is not necessarily the one yielding the fastest query. Benchmark with representative column distributions, sort orders, and query operators.
8.1. Column Pruning and Memory Locality
A query reading only event time and event type should avoid unrelated payload columns. Column pruning eliminates their reads before decompression and expression evaluation. The benefit depends on granule pruning and how data blocks are physically arranged. A high selectivity predicate may still require reading granules containing nonmatching rows; measure actual physical reads rather than ideal row-level selectivity.
Column pruning is valuable only when query expressions actually avoid unnecessary fields. SELECT * on a wide event table can defeat one of the principal advantages of columnar storage. A predicate on one compact column may filter candidates before expensive large-text fields are decoded. Sorting and minmax indexes further reduce accessed granules, but the number of returned rows is not equal to the number read from storage. Performance estimates should use measured per-column bytes and selected marks rather than extrapolate from table row count alone.
8.2. Interaction of Compression Blocks and Granules
Granules are the logical indexing/read-selection units of MergeTree, while compressed blocks define decoding boundaries. Their boundaries need not coincide. Reading one mark range can involve decompressing blocks that contain additional values. Consequently, an estimate based only on selected rows will understate I/O and CPU work unless block and mark granularity are accounted for.
Granules define logical row groups, while compressed blocks determine physical decoding units. They are related but need not correspond one-to-one. Reading one candidate granule may require decompressing a block also containing adjacent data. Smaller blocks can reduce read amplification for sparse access but increase metadata and codec overhead. Larger blocks can improve compression while forcing more unused bytes to be decoded. The optimal parameters depend on sorting, average row width, query selectivity and device bandwidth; fixed figures from introductory examples should not be treated as server invariants.
8.3. LZ4, ZSTD, Delta, DoubleDelta, Gorilla, and T64
LZ4 emphasizes fast decompression, while ZSTD offers tunable compression strength at greater CPU cost in many configurations. Delta and DoubleDelta transform correlated numeric or temporal sequences before compression; Gorilla-style encodings exploit patterns in floating-point changes. T64 packs integer values across a block. Codec choice must reflect type, ordering, entropy, update profile, and actual query resource limits.
[41]
Delta coding represents each value using its difference from the previous value; DoubleDelta codes differences of differences. For evenly spaced timestamps 1000,1001,1002,1003, first differences are 1,1,1 and second differences are zero. This transformation may reduce the number of significant bits in predictable time series but can be ineffective on irregular or randomized values. Gorilla-style encodings exploit recurring floating-point bit patterns; T64 exploits a bounded bit-width representation for integer sequences. These transforms are distinct from LZ4 and ZSTD, which compress the resulting byte stream. Codec chains must respect supported data types and processing order. Define compression ratio C = uncompressed_bytes/compressed_bytes: C=8 means an eightfold ratio, not an 800% reduction in storage. If a timestamp column accounts for 20% of an uncompressed table and compresses eightfold while everything else stays constant, total size becomes 0.8 + 0.2/8 = 0.825 of the original, a 17.5% reduction. Evaluate decompression throughput, CPU consumption and actual compressed bytes under representative orderings; a codec that minimizes disk space need not minimize query latency.
A workload-oriented codec experiment compares the same data in identical sorting order under alternative codec chains. Measure compressed bytes, insertion cost, read decompression CPU and query p99. For a row containing a timestamp plus several uncorrelated strings, a high Delta gain on the timestamp can be negligible for whole-row compression. For a monotonic measurement series, DoubleDelta may generate many zero second differences; on randomly sampled values the same transform can add overhead. Compression performance is therefore a property of data ordering, column distribution and runtime behavior, not a fixed feature of a codec's name.
8.4. Dictionary Encoding and Run-Length Encoding
Dictionary encoding replaces repeated values with compact identifiers, particularly effective for low-cardinality categorical strings. Run-length encoding represents long consecutive runs of equal values. Sort order may strongly improve both techniques, but indexing requirements can favor a different order. A dictionary's memory cost and decode overhead must be included when measuring net benefit.
Dictionary encoding maps repeated values to compact codes, often benefiting low-cardinality strings; its efficiency depends on how many unique values occur within a relevant unit of storage. Run-length encoding represents repeated adjacent values as a value and count, so sort order can profoundly change the achievable compression. A field with only ten distinct values but random ordering may be less amenable to run-length coding than the same values clustered together. Compare the extra dictionary lookup or decoding work against saved I/O, especially when filters frequently access encoded keys.
8.5. Compressibility, Cardinality, and Data Distribution
Two columns with the same logical type can compress very differently when one has clustered repeated values and the other contains high-entropy identifiers. Cardinality is not the sole predictor: temporal correlation, null patterns, and sorting are also important. Distinguish on-disk compressed size from in-memory dictionary and aggregate-state footprints when estimating total capacity.
To compare codecs, construct columns with representative order and entropy: monotonically increasing timestamps, repeated categorical labels, random UUIDs, and floating-point measurements. Measure three separate quantities: bytes written after compression, CPU time spent encoding during ingestion, and CPU plus I/O spent decoding under actual predicates. A codec that wins on cold full scans may lose on warm selective queries. If a sort-key change increases adjacent-value correlation, it may improve compression independent of the codec; isolate this variable before attributing the difference to codec implementation.
Low cardinality alone does not guarantee excellent compression: the ordering and run length of repeated values affect RLE, dictionary and general-purpose codecs differently. Grouping correlated values under a suitable sorting key can create longer runs and smaller deltas, but choosing the physical order solely to maximize compression may degrade the pruning of common filters. A data-type downgrade is not purely a compression decision: converting Float64 to Float32 can change accuracy, overflow behavior, rounding, and aggregated results. Compare compressed bytes per column using system tables rather than inferring whole-table savings from a single sample. When a small subset of columns dominates the stored bytes, optimize those fields first; otherwise the improvement is limited by the unaffected part of the record.
8.6. Codec Chains and the Compression–CPU Trade-Off
A codec chain can apply a numeric transform before a general-purpose compressor. For a query that reads B compressed bytes and expands them at rate δ, decode time has a lower bound B/δ, in addition to disk transfer and subsequent operators. Measure read latency, CPU seconds, compressed bytes, and concurrent capacity together; selecting the highest compression ratio alone can degrade a CPU-bound workload.
Codec pipelines combine reversible type-aware transforms with general-purpose byte compressors when supported. Applying Delta to monotonic integers can expose many small differences, which ZSTD or LZ4 can then compress further. A complex chain may improve disk ratio but increase CPU time on a high-frequency read path. Record both encoding and decoding throughput, because a batch ingestion job and an interactive SELECT have different performance objectives. Reconfiguration of codecs for existing stored data may require parts to be rewritten through background operations or controlled mutations.
8.7. Vectorization and Memory Allocation
Columnar operators benefit from allocating reusable blocks rather than one object per value. Allocation patterns and decompression buffers affect tail latency even when average throughput is high. Analyze intermediate array sizes, nullable masks, string offsets, and temporary aggregation structures. For many concurrent queries, peak live memory rather than average memory determines whether the system can sustain the workload.
A query execution chunk carries column arrays and row-count metadata through processors rather than materializing one object per record. Larger blocks amortize function-call and dispatch overhead but can increase temporary peak memory, cache pressure, and the amount of work performed before cancellation is observed. Operators such as string parsing and variable-length dictionary lookup may not exploit SIMD to the same extent as fixed-width arithmetic. For profiling, separate bytes copied into column buffers from bytes fetched by storage, and distinguish the operator's allocations from persistent table footprint. Parallel pipelines can allocate multiple chunks simultaneously, so peak consumption can rise with thread count even when each chunk has bounded size.
Unit 9: Hardware Architecture and Analytical Query Cost Models
Database performance is bounded by physical resources. A column store benefits from contiguous scans, compression, vectorized operators, and pipelined execution, yet may still be limited by memory traffic, NUMA placement, branching, network shuffles, or the cardinality of hash tables.
9.1. Row and Column Storage: NSM versus DSM
The n-ary storage model (NSM) colocates fields of each row; the decomposition storage model (DSM) stores columns separately and associates values through position or row identity. A query selecting two columns from a wide table avoids reading unused fields in DSM. Point updates and full-row random lookups may favor row-oriented layouts. Compression efficiency also depends on the correlation and ordering of values within each column.
The N-ary storage model (NSM) groups fields of a record, supporting compact access to complete rows. Decomposition storage (DSM) stores fields by column and avoids fetching irrelevant attributes during a selective projection. A column engine must reconstruct relationships between fields when a query requires several columns, but their positional alignment within parts supports efficient reconstruction. Neither layout universally dominates: retrieving one fully populated row can favor a row store, while scanning two columns of a wide table can favor a compressed column store. Measure decompression and per-column read bytes in addition to raw disk usage.
9.2. Disks, Page Cache, and I/O Bandwidth
Sequential throughput, random I/O latency, page-cache hits, and queue depth affect analytical scans differently. Cold and warm tests must be distinguished because repeated scans may be served mostly from memory. Report logical bytes, compressed disk bytes, and decompressed bytes separately; otherwise an apparent bandwidth figure may be misleading. Contention can shift bottlenecks without changing the SQL text.
Page caches and storage caches are distinct from analytical aggregation state. A disk benchmark using sequential buffered reads cannot predict the cost of random small object-store fetches. Effective I/O bandwidth depends on block size, queue depth, compression and concurrent consumers. If the physical device transfers 2 GB/s under the target workload, reading 10 GB requires at least five seconds of transfer time in a simplified model; no SQL optimizer can eliminate that bound without reading less data or serving it from a faster cache. Include CPU decompression when estimating end-to-end latency.
9.3. CPU Cache, NUMA, and Memory Hierarchy
Cache-line locality and predictable memory access improve aggregation and vectorized filters. Large high-cardinality hash tables may exceed last-level cache and incur frequent DRAM accesses. On NUMA systems, remote-memory traffic introduces additional latency and bandwidth constraints. Evaluate allocation behavior and threads per socket under representative concurrency rather than assuming maximum thread count is optimal.
Cache locality depends on both row layout and the access pattern of the current operator. A sequential scan can exploit hardware prefetching and contiguous buffers, whereas a hash join may generate irregular memory accesses dominated by cache misses and pointer traversal. The relevant memory hierarchy includes registers, L1/L2 caches, the shared last-level cache, local NUMA memory, remote NUMA memory, and storage. When worker threads frequently read remote NUMA pages, additional parallelism can increase memory traffic without improving throughput. Counters for cache misses, instructions retired, cycles, and memory bandwidth distinguish arithmetic limitations from memory stalls; their interpretation must account for co-running workloads. Vectorized execution reduces per-row dispatch overhead even when the individual operator cannot efficiently use SIMD instructions.
9.4. SIMD, SSE/AVX, and Vectorized Execution
Vectorized execution processes batches of values through an operator pipeline, reducing per-row interpretation and function-call overhead. SIMD uses one instruction to operate on multiple data elements and can accelerate selected stages of that pipeline. They are related but distinct techniques: vectorized query execution does not imply every operation is implemented through SSE or AVX. Branching, type widths, alignment, and data dependencies affect practical speedups.
SIMD describes executing one instruction across several data lanes, whereas vectorized query execution describes passing batches of values among operators. The latter can improve dispatch efficiency without emitting any SIMD instructions. In an ideal 256-bit AVX2 register, eight 32-bit integers can be compared at once, but masks, memory fetches, branches, decompression and result materialization reduce attainable end-to-end acceleration. SSE, AVX2 and AVX-512 usage depends on target architecture, compiler settings and the exact function implementation; it is inappropriate to assert that every ClickHouse operator is AVX-accelerated. In the roofline model, sustained performance is bounded by min(peak_compute, arithmetic_intensity × memory_bandwidth). For two 8-byte fields and two operations per row, intensity is approximately 2/16 = 0.125 operations per byte. A 80 GB/s bandwidth ceiling would imply at most 10 billion such operations per second before any other overhead, not an expected query throughput. Warm-cache and cold-cache measurements often expose different limiting resources.
An implementation-specific acceleration claim must distinguish the number of input lanes from realized throughput. Processing eight 32-bit values in a 256-bit vector does not imply eight times lower query latency if the data must first be decompressed from slower storage or fetched through a saturated memory bus. Branch-heavy string predicates and hash-table probes may achieve a different speedup from arithmetic reductions. To isolate SIMD's contribution, use the same bytes, operator and cache conditions with an appropriate CPU-feature or implementation comparison. Server versions may compile alternate optimized kernels for different instruction sets.
9.5. Complexity of Scans, GROUP BY, JOIN, and Distributed Exchange
A complete scan is linear in read volume. Hash aggregation is expected linear in input rows with memory proportional to distinct grouping states, subject to skew and collisions. Hash joins require build-side memory; merge joins can exploit sorted inputs. Distributed queries add serialization, transfer of partial states, and coordinator work. Report these resource terms independently of the big-O shorthand.
A sequential column scan is O(N) in the number of inspected values before vectorization and pruning; hash grouping is expected O(N) with memory proportional to the distinct groups, subject to hash quality, skew and resizing. Sorting G groups adds roughly O(G log G) comparison work, while a hash join has expected build-and-probe work O(B+P) and memory tied to the build side. These are computational models, not complete latency equations: spilling, memory allocation, decompression and remote data transfer can dominate. A distributed aggregation ideally computes partial states locally and transfers O(shard_count × groups) state rather than all original rows. Repartition joins may require network transfer proportional to input bytes, and heavy-hitter keys can overload one worker. Performance design must estimate bytes moved and concurrent memory consumption in addition to CPU complexity.
9.6. Amdahl's Law, Concurrency, and Limits of Parallelism
For parallelizable fraction p and n workers, the idealized speedup is S(n)=1/((1−p)+p/n). Synchronization, memory bandwidth, uneven partitions, and final aggregation lower actual speedup. Increasing worker count can reduce single-query latency while harming multiquery throughput through memory pressure. Capacity planning therefore evaluates both one-query and concurrent-query behavior.
For p = 0.98 and n = 32, Amdahl's bound is 1/(0.02 + 0.98/32) ≈ 19.76, well below 32. Actual gains are further reduced by memory bandwidth contention, coordination, and workload imbalance. The serial fraction can increase with the number of partial aggregates and the cost of merging them. Accordingly, a thread-count increase should be evaluated with both wall-clock latency and CPU-seconds; a shorter individual query that consumes much more total CPU may harm service-level objectives under concurrent traffic.
Amdahl's law bounds ideal speedup when a fraction s of computation remains serial: S(p) ≤ 1/(s + (1−s)/p). With 10% serial work, even infinitely many parallel workers cannot exceed tenfold speedup under the model. Actual distributed queries introduce further coordination, network transfer and skew. More threads can also saturate a shared memory controller. This distinction is essential when explaining why doubling worker count sometimes increases total completed queries without halving the latency of one query. Measure both throughput and the critical path of the query execution graph.
9.7. Roofline Model and CPU–Memory Bottlenecks
Arithmetic intensity is the amount of computation per byte moved from memory. A Roofline upper bound takes achievable throughput as min(compute peak, arithmetic intensity × effective bandwidth). Pure filtering and decompression-heavy scans can be bandwidth-limited, while complex expressions or encoding may shift to CPU constraints. Use hardware counters and measured bytes to distinguish these regimes.
A data-processing operation executing 1.5×10¹¹ useful operations and moving 10¹¹ bytes has arithmetic intensity I = 1.5 operations per byte. With sustainable compute capacity C = 3×10¹² operations/s and memory bandwidth β = 120×10⁹ bytes/s, the Roofline bound is min(C,Iβ) = 180×10⁹ operations/s, indicating a memory-bound regime. Increasing vector arithmetic throughput without reducing data movement cannot raise this bound. Compression might reduce disk bytes but still increase memory bytes after decompression; the level of the memory hierarchy being modeled must be specified.
The roofline model separates arithmetic intensity I, in operations per byte transferred from main memory, from the machine ceilings of compute P_peak and sustained bandwidth B. Its bound is P ≤ min(P_peak, I·B). A scan becomes memory-bound below the machine's ridge point P_peak/B; eliminating redundant reads may therefore matter more than widening arithmetic instructions. Compression can raise effective storage bandwidth by transferring fewer bytes, but decompression consumes CPU cycles and temporary memory. A query may shift between disk-bound, memory-bound, and compute-bound phases as caches become warm or concurrency changes. Consequently a single elapsed-time number cannot identify the limiting component. Pair query profiles with observed read bytes, selected marks, CPU counters, memory high-water marks, and storage/network utilization when diagnosing a regression.
Unit 10: ClickHouse Internals and Fundamental Abstractions
A SELECT statement does not immediately become a disk scan. Parsing, semantic analysis, planning and block-oriented execution are distinct stages.
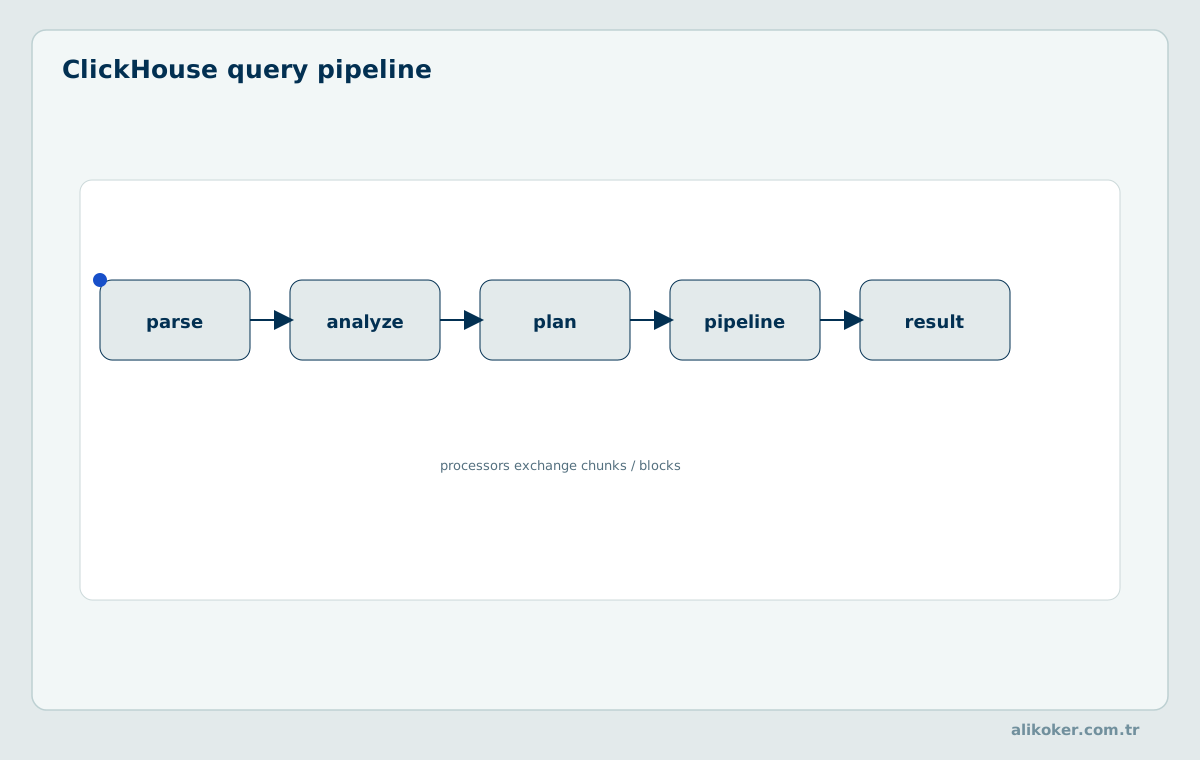
The server joins storage engines, the analyzer and query planner, and pipelines of physical processors. The distinction between logical query operators and their runtime implementation is essential when interpreting EXPLAIN and optimizing latency.
10.1. Storage, Query Processing, and Integration Layers
Storage engines control how rows are written, accessed, and merged. The query processing layer resolves identifiers, optimizes expressions, and executes operators through a pipeline. Integration facilities connect external sources and consumers. A performance problem should be assigned to the correct layer: remote ingestion, index pruning, aggregation state growth, or client-side result transfer.
The storage layer manages immutable parts, compression, indexes and background merges; the query layer parses SQL, constructs plans, schedules processors and combines partial results. Integration components accept inserts, communicate with external systems and expose client interfaces. These boundaries are conceptual rather than permanently separate operating-system processes: execution crosses them during every analytic request. A column read commonly starts with index-driven mark ranges, requests compressed blocks, decodes values into column arrays, and passes chunks through filtering and aggregation processors. Remote shards may compute partial aggregates which are merged by a coordinator. Identifying the stages clarifies whether an observed delay comes from disk I/O, decompression, hash-table operations, remote exchange, or result serialization.
10.2. Native C++ Architecture and Server Life Cycle
ClickHouse implements performance-critical components in C++ and uses asynchronous and multithreaded processing across a server lifetime. Startup requires configuration, storage initialization, metadata recovery, and background worker scheduling. Resource management is dynamic; accepting a query does not mean its memory requirement is reserved in advance. Shutdown and recovery paths should preserve the documented atomicity of data parts.
A native C++ execution engine allows explicit control over column buffers, memory allocation and multithreaded processing, but implementation language alone does not prove low latency. Server lifecycle includes accepting connections, loading metadata, scheduling background maintenance and gracefully or abruptly stopping active work. Startup and shutdown must be examined together with data-part integrity and replay behavior. Thread pools for different classes of work can contend on the same CPU and disks despite their conceptual separation in architecture diagrams.
10.3. Block, Column, Chunk, and Pipeline Abstractions
Columns store typed vectors, while blocks associate columns with names and type information at important interfaces. Chunks convey runtime data through processors in execution pipelines. These abstractions help avoid per-row object overhead while enabling multiple operators to overlap. Their exact interfaces can change across releases, so public semantics should not be inferred from an old internal class layout.
Block, Column, and Chunk are distinct internal concepts. A column holds typed values, a block associates columns with names and types, and execution chunks can move column arrays through processors along with row counts. An execution pipeline is a graph of sources, transformations and sinks rather than an instruction that materializes a complete table between every operator. Processor ports and backpressure govern how chunks flow when downstream operators cannot consume them as quickly as they arrive. The distinction matters for peak memory estimates: parallel operators may retain multiple chunks and aggregation states concurrently. A system that describes itself as vectorized need not guarantee that every internal processor uses hardware SIMD. Internal C++ details can change between versions even when user-visible SQL semantics remain stable.
10.4. Parser, Analyzer, Planner, and Executor Layers
Parsing turns SQL syntax into an abstract representation, semantic analysis resolves names and types, planning selects logical and physical operations, and execution moves chunks through processors. Type conversion or alias resolution can change query meaning before any storage read. Diagnostic output should be read as a plan for a particular server and settings, not as a universal, fixed execution strategy.
An SQL query with an aliased expression can change meaning when identifier resolution is different from that in another DBMS, even if both parsers accept the syntax. Planning may then push filters toward scans, choose aggregation stages, or select a join strategy. A diagnostic sequence is to verify the result on a small known fixture, inspect AST/analyzed expressions, read the logical plan, and finally examine runtime pipeline counters. Measuring only the final wall-clock time cannot distinguish incorrect alias binding from inefficient physical execution.
The parser recognizes valid SQL structures; semantic analysis resolves identifiers and types; the optimizer selects equivalent physical operations; execution processors perform those operations. A valid AST does not establish that a particular filter was pushed into the read stage. EXPLAIN variants expose different levels of structure and should be compared after settings and server version are fixed. A changed optimizer default may alter runtime without changing query text, while type coercion or nondeterministic functions can limit valid rewrites. Distinguish planner output from measured physical read rows and bytes.
10.5. Shared-Nothing and Shared-Disk Deployments
Shared-nothing deployments give nodes their own data placement and fault domains; shared-disk or object-store architectures place some persistent state in shared storage. These choices differ in rebalancing, metadata coordination, network demand, cache locality, and recovery behavior. A shared object store does not automatically make all replicas strongly consistent or remove coordination requirements.
A shared-nothing cluster assigns data to shards and processes it with shard-local resources; shared-storage designs place some durable bytes in common storage while relying on distributed compute and metadata coordination. Failure recovery differs: a cache-only compute node can be replaced without losing authoritative object data, but metadata compatibility and cold-cache performance remain relevant. Shared storage does not remove data locality concerns, nor does sharding eliminate inter-node exchange for global aggregation and joins. State exactly which component owns durability in the selected topology.
10.6. Metrics, System Tables, and Query Introspection
system.query_log, system.parts, system.merges, and profile events expose different portions of runtime state. A log record may be written asynchronously, so query-log absence immediately after execution is not proof of missing execution. Production monitoring should avoid collecting unnecessary sensitive query literals, and measurement overhead must be considered when assessing system behavior.
SELECT name, value FROM system.metrics ORDER BY name LIMIT 30;
SELECT database, table, count() AS active_parts
FROM system.parts
WHERE active
GROUP BY database, table
ORDER BY active_parts DESC
LIMIT 20;
System tables provide current execution and storage state, while logs provide historical events subject to flush intervals and retention. Use the correct source for the question: active parts in system.parts, ongoing merges in system.merges, completed queries in system.query_log, and replica-specific queues where supported. An empty log immediately after a query may reflect delayed flushing, not the absence of execution. Production access to these records should be restricted because query text and diagnostic values can disclose sensitive data.
10.7. Historical and Current Implementation Differences
Documents describing older analyzers, joins, mutations, or cache facilities may become obsolete while preserving a useful conceptual explanation. Keep version-specific claims tagged with release context. Distinguish stable behavior from experimental features and paid-service-only capabilities. Architectural text should express durable invariants first, then the current mechanism implementing them.
Internal implementation names in older engineering presentations should not be treated as public compatibility contracts. The analyzer, optimizer, available JOIN algorithms, asynchronous insert behavior and index facilities have changed over time. Record the ClickHouse version and feature flags when reproducing an old performance result or configuration example. A source describing an experimental capability in one release does not establish production support for every deployment. In particular, an optimizer's availability and whether it is enabled by default are separate claims. Architecture lessons based on immutable parts and sparse mark indexes remain useful, while exact planner transformations and system table columns require version-specific verification.
Unit 11: MergeTree and Physical Data Organization
MergeTree stores data in immutable parts. Column files, granules and marks together define the physical unit of selective reads.
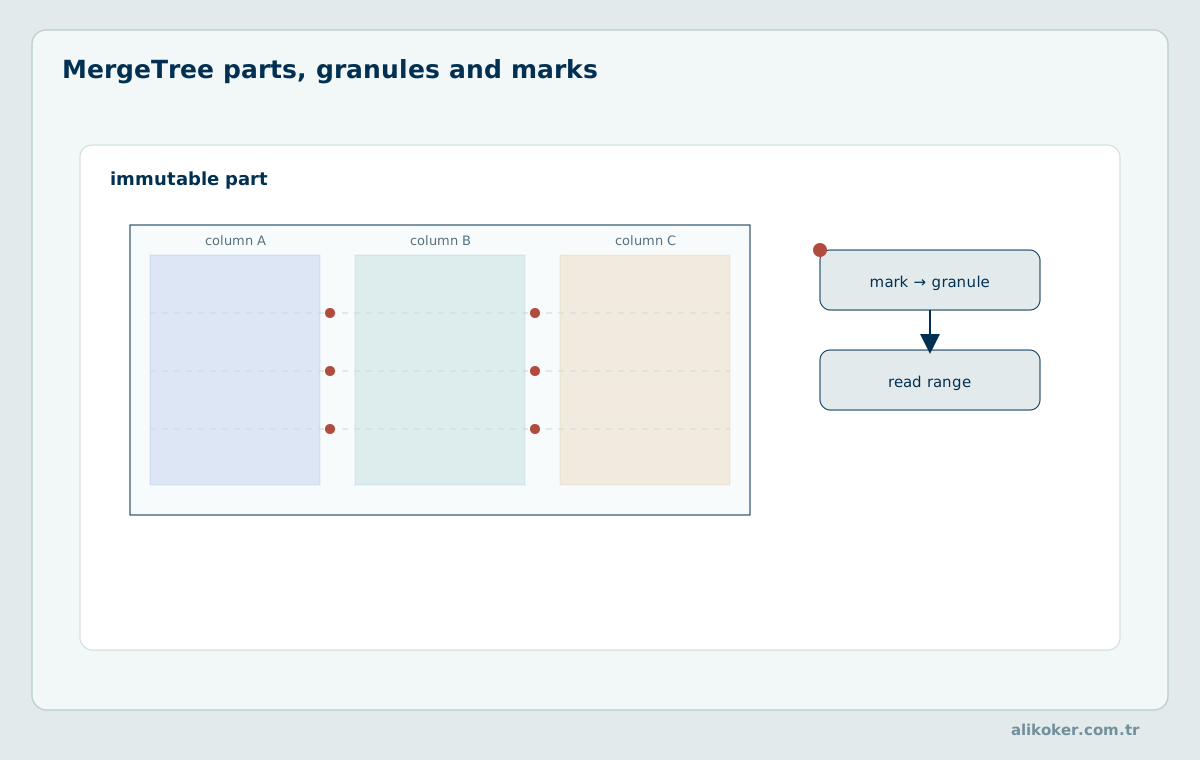
MergeTree is a sorted, immutable-part storage family rather than a conventional in-place B-tree. Inserts generate new data parts; background merges select compatible parts and produce replacements. The interplay of sorting, marks, compression, and part counts dominates many analytical I/O decisions.
11.1. Immutable Data Parts and Life Cycles
Each insertion can create one or more immutable parts, often separated by partition. Background merges replace sets of parts with larger sorted parts. Failure during creation must not expose a partially completed committed part. Analyze active parts and part sizes rather than equating table row count with insertion batch count. Merge backlog is an operational property, not merely an optimization detail.
INSERT typically produces new immutable data parts that later become candidates for background merging. This separation permits readers to access stable part snapshots while writes create new structures. Deleting or replacing a part during maintenance requires coordinated metadata transitions so active queries do not accidentally observe incomplete data. An inactive part may remain on disk after it leaves the logical table, meaning total allocated bytes can exceed the bytes of active data. The rate at which new parts appear is an important predictor of ingestion stability.
11.2. INSERT, Sorted Streams, and Part Creation
An inserted block is partitioned as required, ordered by the table sorting expression, encoded, compressed, and persisted as parts. The workload's partition cardinality affects how many parts one batch creates. A high rate of tiny batches can outpace background consolidation. Prefer ingestion batching and asynchronous-insert semantics validated for the installed version instead of assuming the server will eliminate all small-part overhead automatically.
A batch spanning 24 hourly partitions can produce substantially more parts than an otherwise identical batch routed into one monthly partition. If 500 tiny batches arrive per second, even one part per batch yields 43.2 million initial parts per day before merges. Real servers apply limits and backpressure, but this scale illustrates the danger. Ingestion design should estimate the number of partition/engine output streams per source batch, not merely bytes per second. For low-latency streaming, asynchronous aggregation of small incoming writes into larger flushed blocks can improve sustainability when acknowledgment semantics are acceptable.
Within a MergeTree part, rows are arranged according to the table's sorting key. New INSERT batches need not arrive pre-sorted; the engine performs the necessary part-level ordering during creation. Persistent table-wide order emerges from ordered parts and subsequent merges, not from one global in-place B-tree. An INSERT acknowledgment should be interpreted under its synchronization and durability settings, especially for asynchronous buffering. Immediately reading newly inserted data and later observing the same records after merging are separate consistency checks.
11.3. Wide and Compact Data Part Layouts
Wide parts ordinarily maintain more separate column-related files; compact parts combine information to reduce small-file overhead. The selected representation depends on settings and part size. Layout choice affects filesystem metadata operations, reads, and merge behavior, but not the logical result of a correct SQL query. Inspect physical parts and release-specific documentation before assuming exact filename conventions.
Wide parts organize data for independent column access; Compact parts reduce the number of small files created by many small inserts. These formats are physical optimizations, not alternate logical table schemas. Conversion during later merges and codec behavior depend on version and configured thresholds. File-count reduction can improve filesystem handling, but it does not make excessive small batches harmless: metadata operations and merge work still remain. Inspect actual part formats in system metadata rather than assuming a fixed layout for every table.
11.4. Column Files, Marks, Checksums, and Metadata
Compressed column streams hold values; mark files help seek into them; checksums and metadata support validation and recovery. A mark is not a row pointer equivalent to an OLTP secondary index. Corrupt or missing metadata must not be repaired through casual deletion of parts. Diagnose integrity using supported system facilities and a recoverable backup strategy.
A MergeTree data part contains column streams, index metadata, checksums and descriptive files. The Wide layout stores column-oriented data more independently, whereas Compact layout packs small-part data into fewer files; neither implies that records are stored in classic row-major OLTP pages. Marks associate logical granule boundaries with positions in compressed streams. Checksums validate stored part files and support recovery diagnostics, but they do not establish source-business correctness. A renamed or detached directory is not equivalent to a validated logical backup. Inspecting part metadata should distinguish active parts from inactive historical parts because the latter may still consume disk until cleanup.
11.5. Granules, Marks, and Physical Read Units
A granule groups a range of consecutive sorted rows. The sparse primary index typically stores information at granule boundaries and selects mark ranges for reading. If N rows are organized around target granularity g, a rough count is ceil(N/g), but adaptive granularity and byte thresholds change actual boundaries. Predicates may skip entire granules yet still read unrelated rows inside selected granules.
A one-billion-row table with a nominal granularity of 8,192 rows would have about 122,071 granules before adaptive-granularity effects. A simple 16-byte index tuple per granule implies approximately 1.86 MiB of raw sampled key payload, excluding offsets and allocator overhead. This is why sparse primary indexing can fit economically in RAM at very large row counts. The same calculation shows its limitation: looking up a key can still entail reading and filtering the corresponding granule rather than directly fetching one unique record.
EXPLAIN indexes = 1
SELECT service_id, count()
FROM events
WHERE service_id = 42
  AND event_time >= toDateTime64('2026-10-01 00:00:00', 3, 'UTC')
  AND event_time < toDateTime64('2026-10-02 00:00:00', 3, 'UTC')
GROUP BY service_id;
A granule is a bounded logical group of consecutive rows, and a mark points toward the compressed data needed to read it. A sparse primary index keeps sorting-key values near mark boundaries rather than one index entry per record. If 1 billion records are grouped into granules of 8192 rows, there are approximately 122,071 granules before adaptive granularity and part boundaries are considered. If a query must inspect 4000 granules, the useful row count may be far smaller than 4000×8192; index efficiency is measured by rows and bytes actually read, not merely returned rows. Marks and compressed blocks are related but do not always align one-to-one. An I/O estimate must include the extra bytes fetched because several adjacent granules share compressed blocks and the read unit cannot be narrowed arbitrarily. Adaptive granularity can choose fewer rows for very wide records, so a fixed row count per granule is only a simplified illustration.
For a 1-billion-row part, a fixed granularity of 8192 rows implies approximately 122,071 granules. If a time predicate overlaps two small ranges of the sorting key, the engine searches mark boundaries and reads candidate granules, not necessarily two physically contiguous exact row ranges. The granule may hold unrelated rows with neighboring sort values, requiring the predicate to filter them after decompression. If 800 granules are selected, the upper row-count approximation under the fixed model is 6,553,600 rows even when the query returns only thousands. A compressed block can span more than one granule, making physical I/O larger than the simple selected-row estimate. This mismatch between logical selectivity and physical read amplification explains why effective ORDER BY design matters so much for real latency.
11.6. Mark Cache, Filesystem Cache, and Disk Placement
Mark caching reduces repeated access to sparse-index position information, while the operating system page cache may satisfy compressed-data reads. These mechanisms have different capacity and eviction characteristics. Cache-hit counters should be interpreted alongside bytes read, query repetition, and simultaneous workload. Pinning too much memory for caching can deprive aggregation and joins of working memory.
A mark cache reduces repeated work in locating compressed ranges, while the operating-system page cache may hold the actual bytes read from local files. Remote object stores introduce additional local caching layers. Warming one cache does not imply all others have identical state. Benchmark metadata overhead by tracking marks and part counts; benchmark data access by tracking selected rows, compressed bytes and client-observed latency. Disk placement decisions should account for temporary merge output and background compaction, which can briefly require space beyond the retained active data size.
11.7. Inspecting Part Contents Through System Tables
system.parts, system.parts_columns, and related tables expose active/inactive parts, rows, compressed bytes, and partition information. The effective number of parts per partition often explains write stalls or merge pressure. A diagnostic query should restrict its database and table and should not aggregate inactive historical parts as though they were live. Verify part counts before and after controlled test ingestion.
SELECT
    partition,
    count() AS part_count,
    sum(rows) AS row_count,
    formatReadableSize(sum(bytes_on_disk)) AS disk_size
FROM system.parts
WHERE active AND database = currentDatabase() AND table = 'events'
GROUP BY partition
ORDER BY partition;
Use system.parts to enumerate active and inactive part counts, compressed and uncompressed bytes, partition identifiers and row totals. Compare that snapshot with system.merges and system.part_log where available to determine whether small parts are accumulating faster than background merging can eliminate them. Aggregate only active parts when interpreting the logical table footprint. A sudden increase in part count after numerous tiny inserts often indicates a write-path problem rather than insufficient CPU for one SELECT. Separately inspect mark cache behavior and query read bytes; a table with few parts can still be poorly sorted for the workload. System tables expose implementation state and are not a substitute for source/target data reconciliation.
Unit 12: Sorting Keys and Sparse Primary Indexes
The ClickHouse primary index is not a dense B-tree with one entry per row. Sparse marks over sorted key space identify candidate granule ranges.
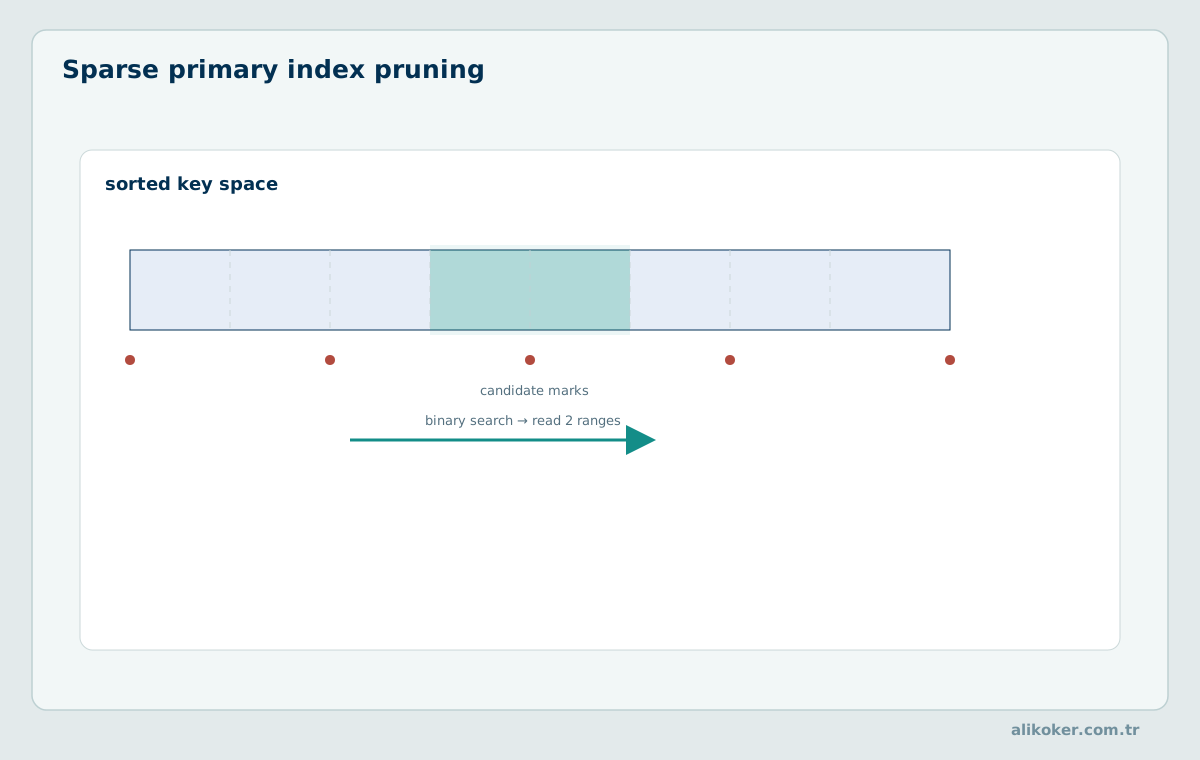
MergeTree sorting keys determine the physical order of values within each part. A primary index samples that order; it does not enforce relational uniqueness. Query patterns and data distribution therefore determine an index's effectiveness more strongly than the mere existence of a column in ORDER BY.
12.1. Semantics of ORDER BY and PRIMARY KEY
ORDER BY defines storage sorting for MergeTree, while PRIMARY KEY can select a prefix or other supported expression for sparse index construction. Duplicate key values are permitted. An OLTP index is not a suitable analogy for exact-key uniqueness checks. Data models requiring one current row per business key need explicit versioning or a separate source-of-truth constraint.
In a MergeTree table, the ORDER BY expression determines physical sort order; PRIMARY KEY determines the prefix or expression used for sparse primary indexing. These clauses are not uniqueness constraints in the relational OLTP sense. Distinct records with equal sorting-key values may coexist, and their interpretation depends on the chosen table engine and merge semantics. A primary key shorter than the sorting key can reduce index memory, while additional sorting-key columns still influence clustering and compression. A conventional OLTP primary-key assumption is therefore unsafe when designing event identifiers or deduplication logic for ClickHouse.
12.2. Sparse Primary Index and Mark Ranges
Index entries identify the boundaries of selected granules rather than one index leaf entry per row. A predicate on a suitably ordered prefix can narrow possible mark ranges without reading complete column payloads. Index memory grows with the number of marks and key width; a highly variable wide string key may consume more memory than a compact numeric prefix.
A sparse primary index does not contain one pointer per row. It retains representative sorting-key values for granule boundaries, enabling binary search to identify candidate ranges. If a billion rows are organized into 8192-row granules, roughly 122 thousand boundaries exist before accounting for parts and adaptive granularity. A hypothetical 32-byte index entry occupies about 3.9 MB before structural overhead. The observed index footprint differs according to key types, encoded values and the number of parts. Because pruning selects ranges of granules, a predicate matching ten rows may still read thousands of neighboring rows. Reading an EXPLAIN plan together with the marks selected is more informative than judging selectivity only from the result size.
12.3. Granularity, Binary Search, and Data Pruning
A sorted sparse index supports searching for candidate ranges through comparisons against key expressions. A boundary granule may contain rows outside the predicate and must still be read. The minimum unavoidable excess read is affected by index granularity, compression-block alignment, and multi-column ordering. EXPLAIN indexes = 1 can be used to examine pruning when supported by the server version.
A sparse key lookup searches a compact sequence of boundary keys, then reads the candidate granules needed to evaluate the predicate. Binary-search cost is small relative to decompressing a large number of poorly clustered ranges. Adaptive index granularity and per-part boundaries mean the mapping from qualifying row count to selected marks is approximate. Examine query plans and server read counters when tuning granularity; reducing marks per read may increase index memory and metadata work, while overly coarse granules increase false-positive data reads.
12.4. Cardinality, Key Prefixes, and Query Patterns
Place frequently selective and consistently filtered dimensions in an order that creates contiguous ranges, subject to workload trade-offs. Selecting the highest-cardinality column first is not a universally correct rule: tenant isolation, temporal range scans, grouping, and compression correlation also matter. Evaluate full-query read bytes, not only index selectivity for one synthetic predicate.
The first sorting-key component should not automatically be the globally most selective attribute. Suppose every query has a tenant predicate but only one in ten includes a time constraint. A tenant-first key can improve most requests by creating contiguous tenant ranges, even if event type has higher global cardinality. Conversely, global reports over all tenants may favor another physical representation, possibly a projection. Measure workload-weighted scanned bytes under representative parameter distributions and avoid estimating selectivity from a uniform model when tenants are heavily skewed.
The highest-cardinality field is not automatically the best leading key. Key-prefix order should reflect frequent predicates and their data distributions. For filters constrained by organization then time, clustering by organization can make time ranges narrower; for global time-range queries, the same organization-first key may cause wider scans. A column added late in the sorting key can still improve compression without materially helping primary index pruning. Compare representative query frequencies and peak resource use rather than optimizing one hand-picked SELECT.
12.5. Choosing Sort Order from Data Distributions
Analyze value frequency, skew, temporal correlation, and access patterns from representative samples. A key (tenant_id, event_date, event_type) favors tenant-scoped history over queries aggregating all tenants by event type. Alternative key orders may reduce scanned granules but worsen compression or ingestion ordering. Compare plans and both read amplification and merge pressure before changing production schema.
Selecting a sort order requires a stable understanding of future queries and incoming data. Highly correlated attributes can offer diminishing filtering benefit when placed next to each other; unrelated high-cardinality values may fragment local ranges. For predominantly append-only time series, temporal locality can reduce codec costs, but skewed service identifiers may still benefit from prefix grouping. Build two candidate tables from identical data, execute matched SELECT and INSERT workloads, and compare read marks, compression, insert CPU and merge pressure.
12.6. Comparing Keys with Representative Domain Models
For event analytics, candidate keys might prioritize source organization, event time, or category. Select several representative queries: exact tenant and time range, global daily totals, and rare-event searches. On identical data distributions, compare read_rows, read_bytes, elapsed time, compressed footprint, and insertion cost. An index order should not be selected from one favorable example.
Consider event data accessed predominantly by organization, service and descending event time. Sorting first by a uniformly distributed event UUID produces poor locality for service filters, even if each UUID lookup is unique. Sorting by (organization_id, service_id, event_time) can cluster relevant time intervals and permit index-driven range pruning. However, if most queries span all organizations and filter only time, the first key columns may limit pruning effectiveness. The correct key follows representative predicate combinations and their selectivities, not a generic rule to place all high-cardinality columns first. Compare candidate schemas using identical rows, equivalent queries, and measured selected marks, read bytes, insert cost and background merge load.
12.7. Estimating Index RAM and Disk Costs
For N rows and mean granularity g, the mark count is approximately ceil(N/g); if a representative primary-index tuple occupies k bytes, index payload is on the order of ceil(N/g)×k before overhead. Adaptive marks and variable-width key fields invalidate an exact estimate. Verify physical sizes through system.parts and cache counters. Disk compression and index-resident RAM are different capacity budgets.
Memory accounting must include the primary index and caches without double-counting disk files. A primary-key tuple containing fixed-width integers has a different per-mark representation from a tuple with variable-width strings. Adaptive indexing can change the number of marks within each part. An engineering estimate should therefore compute an expected bound from row count and granularity, then reconcile it against system.parts and the relevant index/cache metrics after a representative dataset has been loaded.
Primary-index memory can be estimated from marks multiplied by the average stored key width, but both terms vary by physical part. Reducing the number of primary-key expressions can decrease memory and comparison work at the cost of broader scanned ranges. A partitioning policy that creates many tiny parts can multiply index metadata even when the total row count is unchanged. A query's total memory also includes aggregation states, caches, read buffers and concurrent execution pipelines. Summing only the primary index footprint must not be confused with sizing the entire server's RAM. Derive an initial estimate from system tables, then validate it using workload-specific metrics rather than imposing a universal bytes-per-row figure.
Unit 13: Partitioning and the Data Life Cycle
Partitioning supports both pruning and data-life-cycle management. TTL policies can move older data from hot to cold storage and eventually remove it.
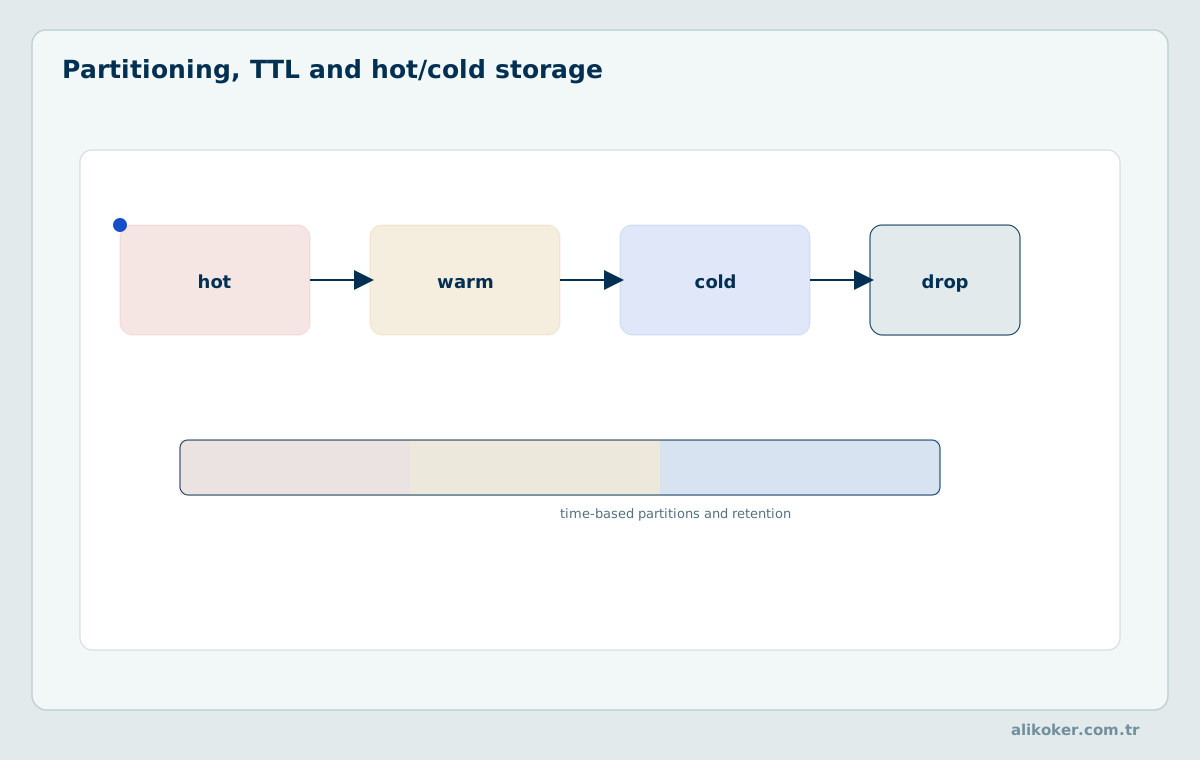
Partitioning is primarily a data-management and large-range pruning facility, not a substitute for selecting a suitable sorting key. Partition cardinality affects the number of parts created, retention operations, and background consolidation. Retention must also distinguish logical visibility from physical erasure.
13.1. PARTITION BY and Partition Cardinality
Monthly or daily partitioning may suit time-based retention depending on data volume and query patterns. Partitioning by a high-cardinality identifier can create an excessive number of tiny partitions and parts. Estimate partitions per batch and total active partitions before deployment. A partitioning expression should remain stable throughout an intended migration or be rebuilt deliberately.
Partition keys define groups within which MergeTree performs physical management and merges; they are not the primary device for arbitrary fine-grained query filtering. A daily partition may be useful for short retention windows but can produce excessive part counts when hundreds of small daily streams receive inserts concurrently. A monthly partition can reduce management overhead when data is mostly retained and queried over longer horizons. Choose cardinality from retention and physical maintenance requirements, then choose sorting keys for the most frequent filter patterns. Separately estimate partition count × active parts per partition when evaluating operational limits. A partition identifier derived from a timestamp should be compared with both event time and ingestion time semantics.
13.2. Partition Pruning versus Sorting-Key Pruning
Partition pruning rules out complete partitions, while the sorting key prunes mark ranges within remaining parts. A temporal partition does not automatically make an arbitrary event-type predicate efficient. A selective sort prefix can be valuable even when partition pruning is poor. Compare plans and physically read bytes to establish each optimization's contribution.
Partition pruning eliminates entire physical partitions when expressions allow it; sorting-key pruning reduces candidate granules inside selected partitions. They are complementary but not equivalent. A predicate on a time range can benefit from a monthly partition key and a service-time sorting key in different ways. Excessively fine partitions can increase part counts while improving partition elimination only slightly. Use query read counters and actual partition counts to choose a sensible boundary rather than turning every indexed attribute into another partition dimension.
13.3. Partition IDs, Part Names, and Management Operations
A partition ID identifies a logical partition for an engine; a part name represents one physical immutable part with additional metadata. Names and layout may vary across versions. Use supported DDL and system tables instead of editing part directories. Operational actions need a verified target database, table, and partition expression, particularly in multi-tenant environments.
A partition identifier is a logical expression result, not proof that the associated disk directory is a complete durable backup. A part name commonly encodes partition and block-related information whose exact representation can depend on versions and storage mode. Partition operations affect metadata and physical objects with different reversibility: DROP PARTITION removes the target dataset logically and schedules cleanup, whereas DETACH PARTITION makes it unavailable to normal queries while retaining detached data for administrative operations. ATTACH must be used only with trustworthy and compatible detached objects. TRUNCATE addresses whole-table rows and has a different blast radius. Production runbooks should include preconditions, selected partition IDs and post-operation row-count checks.
13.4. TTL Deletion, Movement, Recompression, and Rollup
TTL expressions can schedule expiry, storage-tier movement, recompression, and certain aggregation behavior. TTL processing occurs through background work rather than necessarily at the exact logical expiry instant. For regulatory deletion requirements, distinguish when rows become query-invisible from when every persistent replica and backup ceases to contain the original bytes.
A TTL rule removing data after 180 days has at least three relevant dates: the record's timestamp, the time the retention predicate becomes true, and the time physical data no longer persists in active parts. If a backup was taken before deletion, a fourth date governs when the backup expires. An application's claim that a record has been erased must identify which boundary is intended. Retention based on event time can be surprising for late-arriving records, since data may be eligible for expiry immediately after ingestion. Validate the policy with out-of-order event fixtures.
TTL rules can remove expired data, move it to a storage tier, recompress it or derive rolled-up summaries according to supported syntax and engine constraints. Expiry typically becomes effective through background work, so a TTL expression is not a guaranteed instant of physical erasure. A retention deadline should account for delayed merges and replica/backup copies. A rollup TTL must preserve the mathematical semantics of the aggregates being retained, including handling of late corrections and distinct counts. Validate old and new partitions with targeted queries before deleting raw reconstruction data.
13.5. DROP PARTITION, DETACH, ATTACH, and TRUNCATE
DROP PARTITION removes a partition from table visibility and triggers the documented deletion process; DETACH makes data inactive without the same logical destruction intent, and ATTACH can restore compatible detached parts. TRUNCATE targets a broader table-level data removal. These are destructive or operational DDL actions with version-sensitive recovery constraints. Verify backups and exact selection before execution.
SELECT partition, count() AS parts, sum(rows) AS rows
FROM system.parts
WHERE database = 'analytics' AND table = 'events' AND active
GROUP BY partition
ORDER BY partition;
Deleting a partition is fundamentally different from deleting selected rows by a predicate. Partition removal can avoid row-level mutations because the retention unit matches the physical partition boundary. DETACH PARTITION is useful for controlled removal or migration but does not replace off-host backup; disk loss still affects detached files. A partition restored or attached from files must be validated against checksums, expected row ranges and replication topology. Administrative syntax is version-specific; test it on a disposable table before writing operational procedures. Verify the absence or presence of data through active-part metadata and targeted SELECT checks instead of assuming a successful command establishes business correctness.
13.6. Disk and Storage Policies for Hot and Cold Data
Hot data may occupy fast local storage; older data may be moved to slower or remote volumes. TTL movement can reduce local capacity consumption but increase network access latency and retrieval charges. Cache warmup and object-store operations matter for historical scans. Model data size, ingest growth, retention, and replica count together.
Storage policies associate table parts with disks or volumes under placement and movement rules. Hot storage prioritizes low-latency access; cold object storage prioritizes retained capacity and different cost characteristics. Moving data after an age threshold can reduce local disk growth but introduce cache misses and retrieval charges during historical investigations. Estimate temporary merge disk needs separately from retained bytes, and verify which layer owns durable copies in the chosen deployment. A tiered policy is meaningful only when its operational failure modes and expected historical query frequency are documented.
13.7. Time-Based Retention and Capacity Estimation
With daily compressed ingress D, retention R days, and replication factor q, a first estimate for retained compressed data is D×R×q. Add overhead for merges, indexes, temporary files, backups, and caches. Retention based on event time differs from ingestion-time expiration when records arrive late. A realistic capacity model uses high-percentile ingestion rates rather than only daily means.
Capacity illustration: 1.2 TiB of newly compressed events per day retained for 90 days with two replicas requires a base 1.2 × 90 × 2 = 216 TiB of persistent replicated data. This excludes merge working space, sparse indexes, metadata, materialized views, delayed deletion, caches, and backups. If data volume is growing, projecting current daily volume over the entire window underestimates capacity. Compute multiple arrival scenarios and use an explicit high-watermark estimate for provisioning.
SELECT
    database,
    table,
    sum(rows) AS rows,
    sum(data_compressed_bytes) AS compressed_bytes,
    sum(bytes_on_disk) AS bytes_on_disk
FROM system.parts
WHERE active
GROUP BY database, table
ORDER BY bytes_on_disk DESC;
Let d be average incoming compressed bytes per day after indexing and part overhead, R the retention period in days, and r the number of durable replicas. A first-order retained footprint is d·R·r before backups, projections and temporary part rewrites. At 12 GB/day, 180 days and two replicas, this baseline is 4.32 TB. Peak local space can be considerably higher during merges or backfills. Calendar month partitioning and a 180-day TTL are not identical: dropping whole months sacrifices finer expiration precision, whereas row TTL may require background rewrite work. Distinguish both policies in the capacity estimate.
Unit 14: Background Merges and Storage Operations
MergeTree may create small immutable parts on the write path; background merges consolidate them into larger sorted parts. Too many small parts can turn this mechanism into a bottleneck.
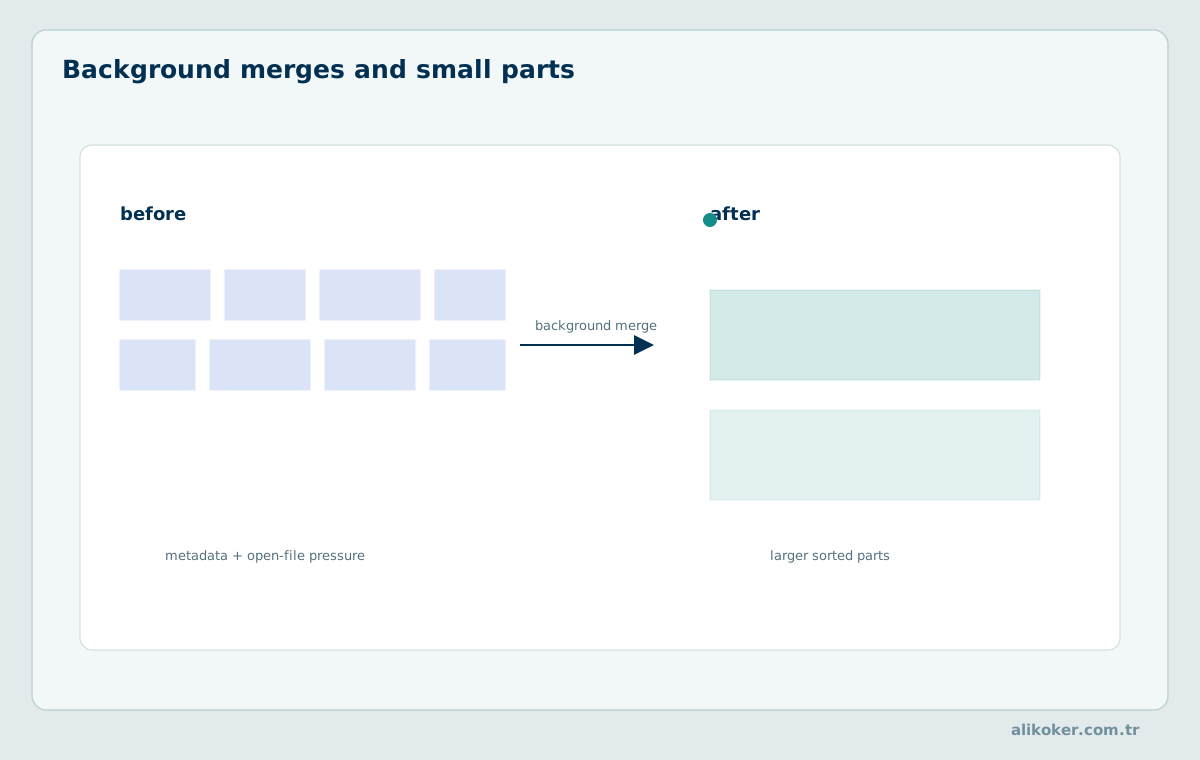
MergeTree transforms newly written immutable parts into larger sorted parts in background tasks. Correctness-sensitive engines may also resolve duplicate versions or aggregate states during those merges. The rate of part creation must be kept below sustainable merge capacity over long observation windows.
14.1. Similarities to and Differences from LSM Structures
MergeTree and log-structured merge designs both defer consolidation and trade extra writes for efficient batch ingestion. However, MergeTree's ordered parts, mark indexes, engine-specific merge semantics, and partition constraints differ from a generic key-value LSM tree. The analogy does not imply identical read paths, compaction levels, or point-update guarantees.
MergeTree resembles log-structured systems in that newly written immutable files are later consolidated, but it is not identical to a classic key-value LSM tree. Parts are sorted by a compound expression chosen for analytical access, and sparse marks support range pruning. Compaction may execute engine-specific aggregation or version replacement. A key-value LSM lookup model therefore cannot be transferred directly to ClickHouse without accounting for columnar files, granules, compression and query-time aggregate processing. Analyze both write amplification and the resulting scan locality.
14.2. Merge Selection, Part Levels, and Concurrency
The scheduler chooses compatible candidate parts subject to size, partition, background-pool, and resource constraints. Concurrent merges compete for disk bandwidth and memory with foreground reads and inserts. Large-part consolidation may be limited to avoid excessive rewriting. Study merge selection and observed system behavior for a given release rather than assuming all small parts are immediately combined.
Background merge selection works over existing immutable parts, grouping compatible parts under resource and size constraints. Merge scheduling must balance reducing part count against the bytes repeatedly rewritten. A stream of very small inserts can create parts more quickly than merge workers can consolidate them. This backlog increases metadata overhead, the number of files opened, read amplification and insert failures when the active part count reaches protective thresholds. The scheduler cannot repair an unbounded input rate with a finite background merge capacity. Observe both incoming part creation and outgoing merge completion over time, and adjust batch sizing or ingestion topology before changing unrelated query settings. Merges occur within partitions and are not arbitrary cross-partition compaction.
14.3. Write Amplification and the Small-Part Problem
Let ingestion produce r parts/s while merge processing sustainably removes m net parts/s; if r exceeds m, active-part backlog grows approximately as (r−m)t. This elementary stability test ignores size classes but captures why high-frequency tiny inserts are problematic. Use fewer sufficiently large batches, appropriate asynchronous insertion, and restrained partition cardinality before increasing background worker counts.
Queueing interpretation: if inserts sustainably generate 400 new parts per second while consolidation removes only 300 net parts per second, the active-part count grows by roughly 100 per second, or 360,000 in one hour, before accounting for any limit or backpressure. The exact merge scheduler is more complex because part sizes and partitions matter, but the conservation relation exposes an unstable workload immediately. A durable fix must lower part creation or increase effective consolidation capacity without starving reads.
Write amplification is the ratio of bytes physically written to bytes logically inserted over a defined interval. An immutable-part merge rewrites records from multiple input parts into a new part; those records may be rewritten again in later levels of consolidation. A high merge rate can therefore saturate storage even when logical insert volume is moderate. For an input rate λ rows/s and an average of k rewritten bytes per logical byte across the merge lifecycle, the storage write demand grows roughly with λ·row_size·(1+k). Actual k depends on insert sizes, part distribution, compression, mutation activity and retention. Monitoring only successful INSERT latency misses this deferred resource debt. The most reliable mitigation is often larger coherent insert batches and an orderly partitioning policy rather than frequent manual OPTIMIZE FINAL.
A stability criterion follows from part count as well as bytes. Suppose an application generates 100 new parts per minute and background merging eliminates an effective 70 parts per minute. Active parts increase by approximately 30/minute, or 43,200 per day, until guardrails or retention intervene. Accelerating one merge stage without changing batch formation may simply move the bottleneck to storage bandwidth. The observed write amplification also increases as records are repeatedly rewritten through merging and index/codec maintenance. Measure this debt over a sustained interval rather than a short ingest burst. Healthy ingestion requires long-run merge capacity at least comparable to the incoming physical-part rate under expected resource contention.
14.4. Background Merge Memory Management
Merges read, decode, reorder, re-encode, and write streams from selected parts. Memory depends on column types, intermediate buffers, and concurrent tasks; I/O amplification depends on bytes rewritten. Aggressively raising merge concurrency can increase interference and queueing. Separate merge throughput measurements from foreground SELECT and INSERT service-level objectives.
Background merges require temporary memory for reading, decoding, sorting or combining rows and writing new parts. Large concurrent merges can compete with foreground hash aggregations and queries for memory and disk bandwidth. Increasing the thread count does not guarantee faster catch-up once storage is saturated. Monitor active merges, input/output bytes and free temporary disk capacity. A persistent merge backlog often indicates inappropriate batch or partition design; adjusting memory limits alone rarely removes the underlying accumulation rate.
14.5. Cost and Safe Use of OPTIMIZE FINAL
OPTIMIZE ... FINAL can force substantial consolidation work and should not be a routine substitute for a sound write pattern. Full-part rewrites can consume significant CPU, disk bandwidth, and temporary space. It may be relevant to controlled maintenance or a correctness-sensitive consolidation goal, but use requires capacity and engine-specific semantics assessment.
OPTIMIZE ... FINAL requests an aggressive merge; it is not a universal maintenance procedure. For a large partition, forcing a near-total rewrite can multiply I/O, consume temporary disk space and compete with SELECT and ingestion workloads. It also does not turn MergeTree into a general transactional uniqueness system. Measure the number and size of active parts, relevant merge queues and available free space before invoking an administrative merge. Prefer normal background merge policies where their convergence is sufficient. Treat explicit optimization as a controlled operation with bounded target partitions, a maintenance window and verification of post-merge part state.
14.6. Aggregation, Deduplication, and Transformations During Merges
Summing and aggregating engines may combine compatible aggregate states; replacing engines select versions by defined keys and version rules. As merges are asynchronous, the number of visible physical rows can differ temporarily from the logical row count the application expects. Query-time FINAL or explicit aggregation may be necessary, with measurable resource costs.
Merging an AggregatingMergeTree does not turn every intermediate state into a finalized business scalar. If events have amount and count states, downstream reads must merge corresponding states before division. An early partial state can coexist with other unmerged states without violating storage behavior. Summing engines similarly require care with unaggregated columns and grouping keys. For replacement semantics, the engine's key is derived from the sorting expression; it may not coincide with the application's notion of a unique user or event. Background consolidation cannot repair a wrong logical key model.
Some MergeTree derivatives transform logical rows while consolidating physical parts. Summing engines may combine numeric values for equal sorting keys; replacing engines select versions; aggregating engines merge stored aggregate states. The transformation is driven by engine and key semantics, not by a generic uniqueness constraint. Results observed before consolidation may differ from results obtained through an explicitly correct query, especially when duplicate versions or unmerged partial states remain. Query logic must be designed for correctness independently of merge timing.
14.7. Analyzing system.merges and Part Accumulation
Track active-part counts by table and partition, part-size distributions, current merge tasks, disk throughput, and insertion errors. A stable total part count does not prove all partitions are healthy: one hot partition may accumulate parts while another is consolidating. Link measurements to time windows and query demand; avoid broad introspection scans during critical production periods.
SELECT
    database,
    table,
    elapsed,
    progress,
    num_parts,
    formatReadableSize(total_size_bytes_compressed) AS total_compressed
FROM system.merges
ORDER BY elapsed DESC;
A stability diagnosis compares the rate at which insertions create new parts to the rate at which merges eliminate parts. Let P(t) denote active part count; an approximate relation is dP/dt = λ_parts_created − λ_parts_eliminated, excluding explicit part drops. If the long-run average remains positive, part count grows until capacity or server guardrails intervene. Partition counts and part counts must be assessed together: a high-cardinality partition key can spread inserts across many independent merge domains. Inspect system.parts, system.merges, system.part_log, and relevant query or asynchronous insert logs where supported. A spike in merges alone does not prove a failure; pair these observations with query latency, write throughput, and disk bandwidth before changing scheduler configuration.
Unit 15: MergeTree Table Engines and Merge Semantics
ReplacingMergeTree can physically retain multiple versions of the same key. Which version is visible depends on merge progress and read semantics.
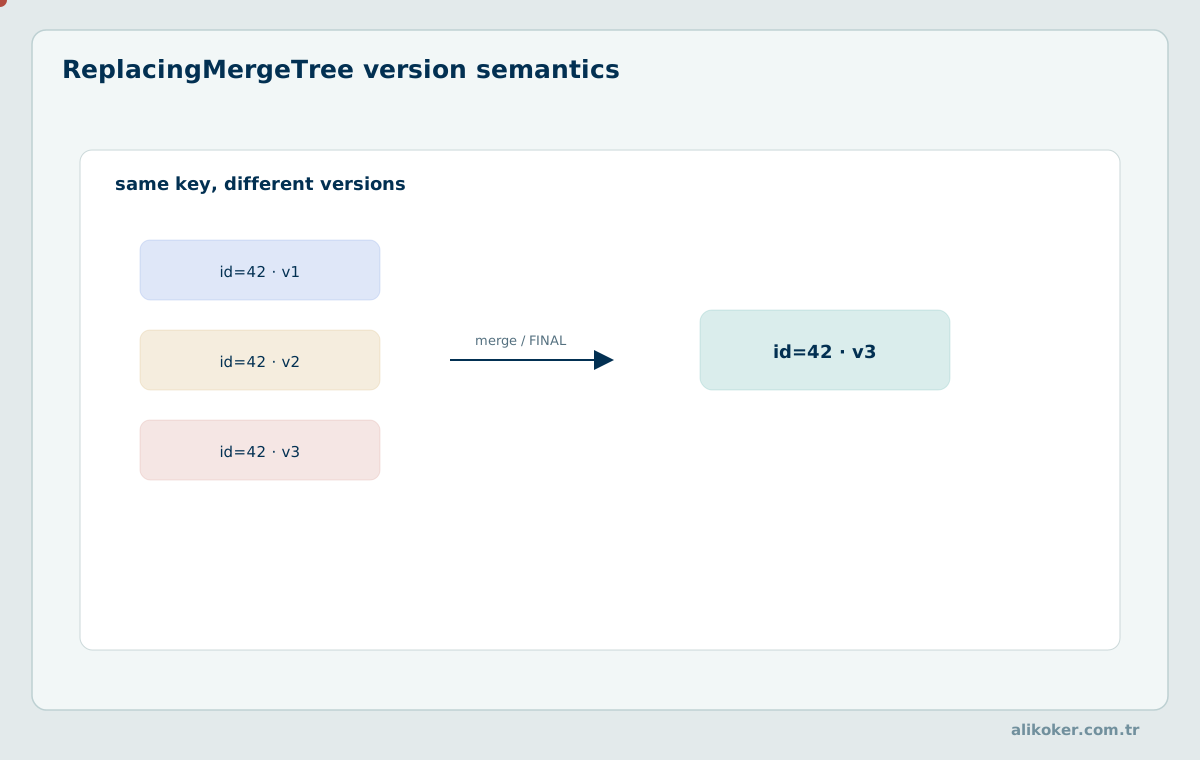
MergeTree engines share immutable-part storage but assign different meanings to background consolidation. Choosing an engine because its name suggests deduplication or aggregation is insufficient; define logical keys, versions, signs, merge boundaries, and expected query-time behavior.
15.1. MergeTree and ReplicatedMergeTree
Ordinary MergeTree provides sorted-part analytical storage; ReplicatedMergeTree adds replication coordination and part distribution. Replication does not imply that all reads observe a globally synchronized snapshot. Configure replication paths and cluster topology correctly and measure lag. Backups remain necessary because destructive logical operations can propagate to replicas.
The base MergeTree family writes sorted immutable parts and organizes background merging locally. Replicated variants coordinate copies of those parts among replicas and introduce metadata availability and lag considerations. Replication is not automatic cross-shard duplication; a shard usually represents a subset of the logical dataset, and replicas hold corresponding copies. Both engines retain sorting-key behavior and sparse indexing, but their recovery and operational costs differ. Design read routing with explicit tolerance for replica freshness rather than assuming replicas always expose an identical instant.
15.2. ReplacingMergeTree: Versions, Deletion Marks, and FINAL
ReplacingMergeTree selects representative rows sharing the sorting-key identity during background merges, optionally considering a version and deletion marker. Physical duplicates may exist before consolidation. FINAL can apply replacement semantics at query time, subject to engine settings and filtering rules. A deletion marker is not proof of immediate physical erasure; retention and cleanup require a separate policy.
A concrete current-state model stores (business_key, version, deleted, payload) and sorts by a key whose identity matches the business entity. When a deletion occurs, a later version with deleted=1 can hide earlier state under suitable query semantics. If versions are not monotonic per key, however, a delayed older update may replace a newer one unexpectedly. If two changes have identical versions, tie-breaking must be defined at the source or with an additional ordering rule. FINAL addresses merge visibility; it does not manufacture correct source ordering.
CREATE TABLE latest_states
(
    record_id UInt64,
    version UInt64,
    deleted UInt8,
    state String
)
ENGINE = ReplacingMergeTree(version, deleted)
ORDER BY record_id;

INSERT INTO latest_states VALUES
(7, 1, 0, 'OPEN'),
(7, 2, 0, 'CLOSED'),
(8, 1, 0, 'ACTIVE'),
(7, 3, 1, '');

SELECT record_id, state
FROM latest_states FINAL
WHERE deleted = 0
ORDER BY record_id;
[8]
ReplacingMergeTree's version comparison chooses a winning row for matching sorting keys only as parts are merged or when query semantics explicitly request appropriate finalization. Background merges are asynchronous and do not enforce immediate uniqueness on every insert. A delete marker models logical removal of a versioned key; physical cleanup and the visibility of older versions require separate analysis. A naive SELECT without finalization can observe more than one version, depending on part state. An analytics pipeline can instead preaggregate last-version state by key when that fits the query. Exactly-once delivery is not conferred merely by choosing a replacing engine: stable source identifiers, version ordering, replay rules and query correctness remain necessary.
15.3. SummingMergeTree and AggregatingMergeTree
SummingMergeTree merges suitable numeric measures for rows sharing a sort key. AggregatingMergeTree stores and combines aggregate-function states, including mergeable approximate structures. Query writers must know whether columns hold raw values, scalar sums, or intermediate states. A mean cannot be safely merged by summing precomputed means without accounting for counts.
SummingMergeTree merges compatible numeric measures for rows sharing the relevant sorting key, but arbitrary columns and complex business measures do not become automatically additive. AggregatingMergeTree works with aggregate states and supported merge functions; query-time finalization produces results appropriate to the stored state type. A numeric percentage stored as a scalar should not be summed across groups. Include the dimensional grain in the sorting key deliberately; collapsing all keys together can erase required distinctions. Validate correctness before and after background part merging to ensure the read query accounts for partial states.
15.4. CollapsingMergeTree and VersionedCollapsingMergeTree
Collapsing engines model row-state transitions using sign values and, in the versioned form, ordering information. Their correctness depends on how positive and negative rows are paired under the defined processing semantics. Out-of-order updates and replayed events can break naive assumptions. Prefer a documented source event contract with reproducible tests over relying on eventual merges to repair inconsistent input.
Collapsing engines model row cancellation with sign information; versioned variants introduce ordering semantics that help represent state changes. Mispaired signs, retries or reordered events can produce unexpected intermediate results. These engines are not a transparent substitute for OLTP row updates. Query logic must be prepared for parts that have not yet merged and for failure recovery that replays events. The correct engine is selected according to whether the source can produce stable cancellation and version information, not simply because the table contains frequent updates.
15.5. AggregateFunction and SimpleAggregateFunction States
AggregateFunction represents serialized intermediate state for a particular aggregate and can be merged when compatible. SimpleAggregateFunction stores values for aggregates whose combination can be expressed through the designated operation without preserving a complex state. Schema and function parameters determine compatibility. Arbitrarily substituting scalar outputs for aggregate states may silently change results.
AggregateFunction stores a function-specific internal state suitable for later merging; SimpleAggregateFunction represents certain simpler aggregate semantics without the same serialized-state requirements. Not every function can be converted by substituting one type declaration for the other. State compatibility, schema migrations and query finalization must be considered when storing these values for long periods. Mixing final numeric values with intermediate aggregate states can silently double-aggregate or corrupt statistics. Test state merging across insert batches and shards before relying on an optimized schema.
15.6. Deduplication Correctness and Merge Delay
A replacing engine's merge-time deduplication is not a primary-key constraint. Distinguish duplicates generated by at-least-once delivery from multiple genuine source versions. If immediate latest-state visibility is required, choose query semantics that account for unmerged parts. Record the acceptable merge delay and benchmark FINAL under realistic cardinality.
Physical merges may eventually eliminate redundant versions under the engine's rules, but there is no reliable fixed wall-clock deadline at which all duplicates disappear. A stable business key and source version must be provided to make deduplication well-defined. A query that requires current logical state should select the correct version even when no merge has run. Replaying an old event after a later version must not restore stale values, and deletes need explicit tombstone semantics. Correctness tests should include equal versions, out-of-order delivery and interrupted background merges.
15.7. Versioned Updates and Reading Correct Results
Version order must reflect a monotonic source property; an event timestamp alone may be insufficient when late corrections can share or reverse times. Source transaction identifiers, log sequence numbers, or per-key versions may be needed. For current-state queries, establish how tombstones are applied and how ties are resolved. Compare final results against source records at an explicit commit boundary.
Version-based upsert modeling is especially sensitive to ties. Two records with the same ordering key and same version do not supply a deterministic business conflict resolution unless an additional ordering contract exists. The business identifier may not be the same as the MergeTree sorting key, and including mutable attributes in the latter can prevent two versions of one logical record from matching. Late corrections should carry a monotonic source order or explicit arbitration rule. A physical mutation is different from an append-plus-version replacement: the former changes existing stored values over time, while the latter depends on read-time or merge-time version selection. Choose one semantics consciously and test it under retries, restarts and concurrent ingestion.
Unit 16: Other Table Engines and External Data Sources
ClickHouse provides engines with different durability, query, and integration properties. They should not be treated as interchangeable forms of persistent MergeTree storage. External connectors can be useful for migration and federation but introduce remote failure modes and pushdown limitations.
16.1. Memory, Log, TinyLog, StripeLog, and Buffer
Memory-oriented and Log-family engines have different persistence, indexing, and concurrency characteristics from MergeTree. A Buffer configuration can temporarily accept data before flushing into a destination, which introduces distinct loss and backpressure considerations. Validate durability, recovery, and operational constraints rather than selecting an engine based solely on convenient insertion syntax.
[41]
Memory-engine tables primarily serve transient fast-access data and do not provide the durable part lifecycle of MergeTree. The Log family makes different compromises in file layout, concurrent processing and indexing; these engines should not be assumed to offer MergeTree's pruning and merge behavior. The Buffer engine batches records before forwarding them to a destination and introduces operational considerations around buffered visibility and crash recovery. A restart test distinguishes what was committed to durable storage from what was only present in process memory. Engine selection must include durability, recovery, query pattern and ingest rate, not only a throughput number measured in a short benchmark.
In a durability experiment, insert known rows into each engine, force a server restart, and compare query results and system-table state. Repeat with a clean shutdown and an abrupt process termination because these failure paths are not equivalent. For a Buffer destination, confirm whether a row had reached the underlying durable engine before the interruption; request acceptance alone is an insufficient test. Log-family engines should be examined for supported concurrent writes and scanning capabilities rather than assumed to provide MergeTree's mark-based access.
16.2. Distributed, Merge, Dictionary, and Set
The Distributed engine routes requests and optionally data across shards while relying on underlying storage engines. Merge-like engines can provide logical aggregation over other tables. Dictionary and Set engines support lookup or membership-oriented use cases. They do not all own persistent data with the same semantics, so backup and retention plans must target the actual storage layer.
A Distributed table is a query-routing abstraction across shards; it does not necessarily store the complete underlying dataset locally. Merge can read across compatible local tables, while Dictionary and Set engines support particular lookup or membership patterns. These facilities have different persistence, update and read-consistency properties. A distributed query may contact multiple shards and combine partial states, but data relocation and replica selection remain distinct operational responsibilities. Ensure the target tables and cluster topology are explicitly defined before interpreting a logical table name as one durable storage unit.
16.3. Kafka, MySQL, PostgreSQL, JDBC, and URL
Integration engines offer ways to read or stream from external systems and are subject to the behavior of remote protocols and credentials. Kafka-backed ingestion must specify consumer groups, offsets, and materialized-view processing. MySQL/PostgreSQL connectivity does not grant the full transactional semantics of those source databases inside ClickHouse. Network errors and schema mismatch require explicit recovery behavior.
A Kafka engine that supplies source messages to a materialized view is not interchangeable with a durable MergeTree table containing those messages. The broker controls offset retention; the consumer controls progress; the target table controls storage and query semantics. After an interruption, the same messages may be read again, depending on checkpoint sequence. A direct PostgreSQL or MySQL table engine instead queries a remote operational service and inherits its network latency and availability. This distinction matters when an application requires predictable p99 latency independent of the source database.
Kafka-engine integration consumes broker records as a stream, typically feeding materialized views or other processing. It does not inherently make broker offsets, ClickHouse inserts and every downstream aggregate one atomic transaction. MySQL, PostgreSQL and JDBC integration expose external data through their own connectors and conversion rules; querying them can introduce source load and network latency. A URL engine retrieves remote data without guaranteeing stable snapshots unless the endpoint itself provides them. Choose federation only when its freshness and consistency semantics satisfy the analysis.
16.4. S3, HDFS, File, and Table Functions
Table functions can query files and remote objects without making every dataset a persistent local table. Format detection, partition discovery, object listing, and remote range reads influence performance. Repeated scans may pay network and parse costs. Object-store credentials, access scope, and the consistency of metadata snapshots must be part of the design.
[41]
S3, HDFS and File integrations can query or import externally stored formats. Their performance depends on file sizes, partition layout, compression and the number of remote requests. A Parquet dataset with well-chosen row groups and metadata can allow selective reads; thousands of tiny objects can magnify per-request overhead. External file contents can change while a long query is running unless the object or snapshot reference is immutable. Record schema versions and file manifests when reproducibility matters. Table functions are convenient interfaces, not a replacement for a durable ingestion and validation contract.
16.5. External Sources, Engine Selection, and Limitations
Choose engines according to durability, mutation requirements, read amplification, data freshness, and fault domains. An integration that reads source data on demand differs from CDC replication into a local MergeTree table. External dependencies can dominate p99 query latency and availability. Preserve operational ownership of the source system and avoid presenting read-only bridges as bidirectional replication.
[41] [47]
A table engine that exposes a remote source does not necessarily copy or transactionally replicate it. Query pushdown capabilities, snapshot visibility, data type conversions and network retries differ by connector. A remote MySQL lookup can be suitable for a small reference dataset but disastrous if invoked for every row of a billion-row scan. Kafka integration represents a stream-consumption interface, not an indexed historical fact table by itself. S3 and file table functions can query external data directly, but their latency and partition-pruning behavior depend on file organization and metadata. Distinguish temporary federation, batch ingestion and continuous CDC as separate integration modes with separate correctness contracts.
16.6. Buffer, Disk, and Cache Behavior
Buffers may reduce per-insert overhead but move failure responsibility into an intermediate stage. Persistent disk writes, memory buffers, and query caches have different visibility and recovery semantics. Acknowledgment of acceptance does not always mean all downstream consumers have committed a copy. Instrument each stage with appropriate counters while avoiding an unbounded observability burden.
Buffering smooths short bursts but relocates visibility and failure boundaries. A source event acknowledged while held only in volatile memory has a different durability status from a record persisted in a MergeTree part. Caches likewise accelerate reads but do not constitute authoritative copies unless the storage architecture explicitly defines them as such. Inspect the destination engine and replication status to establish persistence. In a benchmark, distinguish buffer-acceptance throughput from stable target-table ingestion throughput.
16.7. Consistency and Operational Properties of Table Engines
Engine selection should be driven by explicit invariants: whether data survives restart, whether duplicate events are possible, and when a reader observes changes. Test node failure, replay, and interrupted background tasks in an isolated environment. Document what cannot be guaranteed, especially multi-table atomicity and mutable source identity.
An engine matrix should compare physical indexing, durability, background maintenance, replication support, write mutation behavior and query semantics. MergeTree offers ordered immutable parts and sparse indexing; a Memory table trades persistence for speed; a Distributed table routes work rather than providing local durable storage for every logical row. Dictionary-backed lookups depend on refresh policy and source availability. A Kafka engine's consumption offsets and materialized-view processing do not guarantee that every downstream side effect is exactly once under a crash. The selection process should trace one insert and one query across failures, not simply list supported SQL statements.
Unit 17: Data-Skipping Indexes, Caches, and Memory Management
Data-skipping indexes reject irrelevant granules, while PREWHERE reads narrow filter columns first and delays wider payload columns until rows survive.
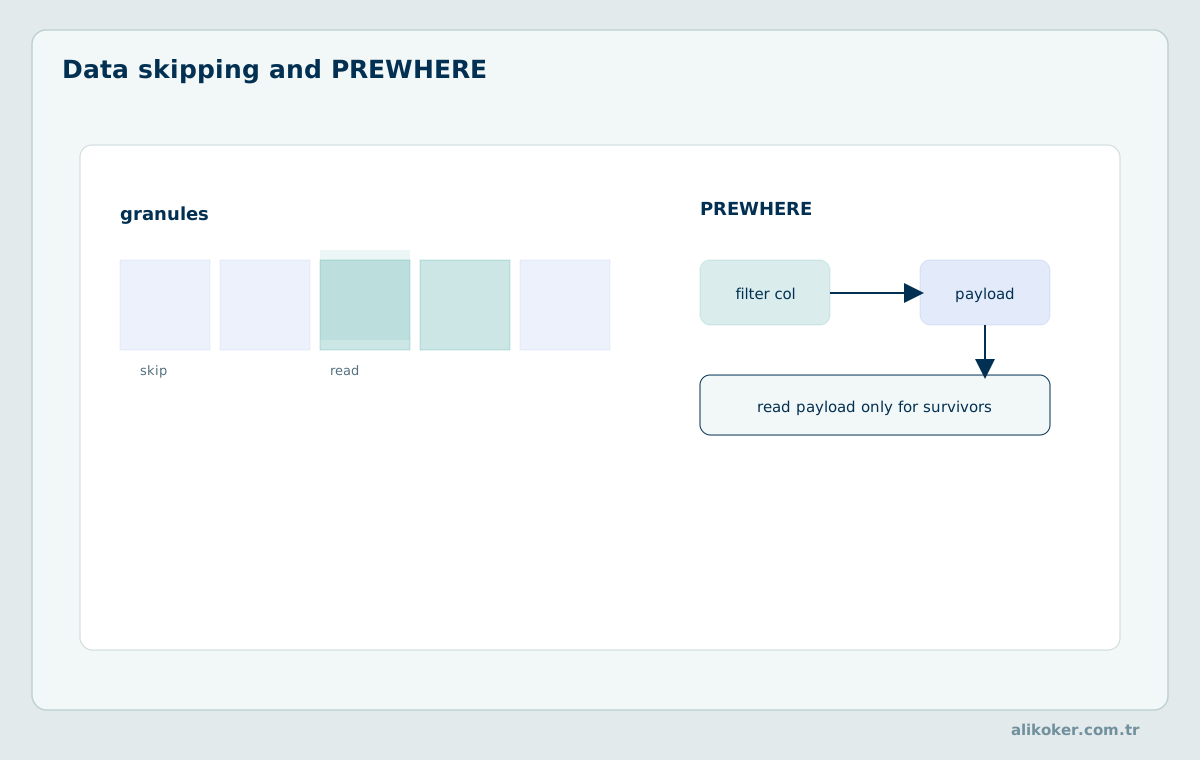
ClickHouse employs several different pruning and caching facilities. Sparse primary indexing, data-skipping indexes, predicate evaluation during scans, and caches operate at different stages and incur distinct costs. Their measured benefit depends on data clustering, workload repetition, and memory availability.
17.1. Primary-Index Pruning, Data-Skipping Indexes, and False Positives
Primary-index pruning removes mark ranges based on sorted-key intervals. Skipping indexes store summaries that can reject granules or blocks for particular predicates. A false positive means unnecessary data is read, not that a matching row is lost, assuming correct index implementation. The relevant metric is reduction in actual physical reading after accounting for index evaluation overhead.
Primary-key pruning searches sorted key ranges, whereas data-skipping indexes summarize values over granule groups. A Bloom filter can reject many definitely absent candidates but may produce false positives; it must not produce false negatives within its supported representation and query semantics. Index effectiveness depends on the distribution of values and the configured granularity. The final WHERE predicate remains necessary to validate actual rows after the index limits candidate reads.
17.2. Minmax, Set, Bloom, and Text Indexes
Minmax summaries suit ordered or locally correlated values; set indexes are useful when distinct values per granule remain bounded. Bloom filters offer probabilistic membership rejection with tunable false-positive rates; text indexes target token or substring-related access patterns according to implementation. Indexes add write and storage cost. Test selectivity and index materialization on existing data before judging effectiveness.
Bloom-filter sizing example: to test membership for n = 10⁶ keys with desired false-positive probability p = 0.01, the standard idealized estimate is m ≈ −n ln(p)/(ln 2)² ≈ 9.59×10⁶ bits, approximately 1.20 MB, and k ≈ (m/n)ln 2 ≈ 6.64 hash functions. Round k to a supported integer and confirm that the filter implementation uses the expected hashing and granule organization. Index usefulness also depends on predicate frequency, source value clustering, and the number of compressed blocks it helps avoid.
ALTER TABLE events
ADD INDEX event_type_skip event_type TYPE set(100) GRANULARITY 4;

ALTER TABLE events
MATERIALIZE INDEX event_type_skip;

EXPLAIN indexes = 1
SELECT count()
FROM events
WHERE event_type = 'ERROR';
[28] [48]
Minmax indexes work well when values within blocks occupy narrow ranges. Set indexes help when a small number of distinct values characterize each block; their value diminishes as local cardinality grows. Bloom filters trade bit capacity and hash computations for a probabilistic false-positive rate, often approximated as p ≈ (1−e^(−kn/m))^k for n inserted items, m bits and k hash functions under simplifying assumptions. Text indexes serve different token-matching needs and can have version-specific restrictions. After adding an index, verify whether historical parts require explicit materialization before expecting old records to benefit.
17.3. PREWHERE and Deferred Column Reading
PREWHERE may evaluate selective columns early and defer loading expensive payload columns until candidate rows remain. It does not automatically create row-level random access into every compressed block. Filter selectivity, storage order, and block boundaries determine savings. Assess bytes read and CPU allocations rather than assuming an explicit PREWHERE clause is always faster.
SELECT
    event_time,
    service_id,
    message
FROM events
PREWHERE event_type = 'ERROR'
WHERE event_time >= now() - INTERVAL 1 HOUR
ORDER BY event_time DESC
LIMIT 100;
PREWHERE can read a narrow set of filter columns first, then fetch additional columns only for candidate ranges or rows according to the execution path. Its benefit is greatest when expensive columns can be deferred and the predicate is selective. A broad filter or a condition dependent on large fields may produce little benefit. The logical WHERE result is unchanged when the optimization is semantically valid; physical read bytes and decompression work are the quantities that should change. Measure both automatic and explicit placement rather than assuming explicit PREWHERE always wins.
17.4. Index Selectivity and Cost–Benefit Analysis
Let p be the fraction of physical blocks rejected and cᵢ the cost to consult an index. A skipping index is beneficial when the avoided scan and decoding cost exceeds index lookup and storage/maintenance overhead. Correlation of values within granules is often more important than global cardinality. Include build and merge cost in the evaluation, not only SELECT latency.
An index pays off when avoided read and compute work exceed maintenance, metadata and query-planning overhead. If a predicate frequently matches most blocks, a skipping index adds little value regardless of its sophistication. An index on a highly unique field can be effective only when values cluster appropriately in indexed blocks; global uniqueness alone does not imply local pruning. Measure workloads with the same data size and ingestion profile before and after index creation, including any materialization cost on existing parts.
17.5. Query, Condition, and Userspace Page Caches
Query-result caches store reusable outputs, condition caches may accelerate repeated predicate range selection, and userspace/page caches serve underlying data reads. Cache keys, settings, invalidation, and memory budgets differ. Result reuse requires semantic compatibility including settings and data changes. A cold benchmark and a warmed benchmark answer different operational questions.
[41]
Cache layers answer different questions. The operating system page cache stores recently accessed file pages, a mark cache accelerates locating granules, and specialized query or condition caches can reuse eligible computation or pruning information. A result cache—where available—is not the same as a column-data cache and must have carefully defined invalidation rules. Running a query twice and reporting only the second latency can dramatically exaggerate the benefit of a schema if the first execution populated caches. Experiments should report cold and warm conditions separately and avoid assuming that clearing one cache empties all layers. Under concurrency, multiple queries compete for cache capacity, so single-query warm-cache benchmarks do not establish service performance.
A caching experiment can run four cases: a cold first execution, a warm repeat on the same data, a different but related query that reuses compressed blocks, and concurrent queries that compete for cache capacity. The four cases expose distinct benefits from data and metadata locality. A cache that stores a prior query result may have correctness-sensitive invalidation rules, while a page cache only stores file bytes; they should not be combined into a generic “cache hit rate.” A query plan can be identical in both cases even though elapsed time differs radically. Report actual read bytes from the engine and remote storage requests separately when possible.
17.6. Cache Invalidation and Warm/Cold Query Behavior
An analytical replica receiving constant inserts changes its data set even when query text is identical. Determine whether cache entries are invalidated, bypassed, or conditionally reused, and what happens after restart. A cache warmed by a benchmark can distort hardware comparisons. Report per-run byte reads and cache state, and do not attribute all changes to SQL optimization.
A warmed cache can hold compressed blocks, marks or eligible query state, but cache invalidation rules differ across layers and software versions. A result derived from mutable data cannot be safely served indefinitely merely because its input SQL text is unchanged. Cold-cache tests should document exactly which layers were cleared or bypassed. Concurrent workloads evict one another's cache lines and pages, so the benefit seen on an isolated second execution is not necessarily available at production concurrency.
17.7. Memory Limits, External GROUP BY/SORT, and Spill to Disk
Hash grouping, sorting, DISTINCT, eligible joins, and supported IN-set operations may have spill strategies that exchange memory pressure for disk I/O. Each has version-dependent thresholds and settings. Spilling can avoid failure under a constrained memory limit but need not improve latency. Test available temporary-space capacity and cleanup after interrupted queries.
External aggregation is a controlled exchange of memory consumption for temporary disk I/O. If an in-memory grouping would require 18 GiB but a workload has a hard 8 GiB ceiling, spilling may allow completion with additional passes and merge phases. However, the temporary disk must handle the full intermediate representation, and concurrent spill operations can saturate bandwidth. Record temporary bytes, CPU time, peak memory, and elapsed time. A query that survives by spilling can still violate latency objectives or interfere with ingestion.
[41]
Hash aggregation, sorting, IN sets and joins can require memory far beyond the compressed input bytes. A high-cardinality GROUP BY retains distinct keys and aggregate states; a sufficiently large order-by or join can spill to disk when the corresponding external-processing setting and version support it. Spilling trades memory pressure for additional writes and reads, and it may materially increase tail latency. Per-query memory quotas interact with overall server limits: ten queries each within a 4 GB budget can still exhaust a machine with insufficient free memory. Collect peak query memory, temporary disk bytes, process RSS and concurrent active queries; none alone fully describes the risk.
17.8. Memory Overcommit and Out-of-Memory Scenarios
Memory trackers and overcommit controls mediate allocation limits; the operating system may still terminate a process under severe pressure. Peak allocations during decompression, joins, and merging can exceed steady-state values. Diagnose failures using query memory, process RSS, and workload concurrency. Do not turn off resource safety limits merely to achieve a benchmark result.
Memory overcommit mechanisms can help recover from transient pressure by selecting work for cancellation or applying limits, but they are not a substitute for capacity planning. Hash join builds and distinct aggregation states can grow abruptly with input cardinality. At high concurrency, aggregate process memory may exceed physical RAM even if each query respects its individual limit. Distinguish application memory exceptions from Linux OOM-killer termination and from temporary disk exhaustion due to spill. Test the recovery behavior of clients and upstream retry systems after each failure type.
Unit 18: Advanced SQL, Statistics, and Time-Series Analysis
Analytical functions range from exact arithmetic and windows to approximate cardinality and quantiles. Mathematical meaning, memory complexity, and mergeability determine their suitability for distributed partial aggregation and materialized storage.
18.1. Arithmetic, Boolean, and Conversion Functions
Explicit conversions are safer than permissive implicit casts when ingesting heterogeneous events. Arithmetic must account for integer overflow, decimal scale, floating-point nonassociativity, and invalid inputs. Boolean combinations of nullable predicates follow dialect-specific three-valued rules. In distributed calculations, changing evaluation order may alter floating-point low-order bits without indicating a database defect.
Numeric conversions may truncate, overflow or return special values depending on type and function. A cast of a string to an integer should explicitly define behavior for malformed input, negative values and values beyond range. Floating-point aggregation can vary slightly with parallel reduction order; a Decimal representation is preferable for measurements requiring fixed-scale monetary precision when its range is adequate. Boolean expressions involving nullable fields follow three-valued logic. Test arithmetic edge cases before embedding conversions into materialized views whose results may be difficult to correct retroactively.
18.2. Strings, Regular Expressions, Arrays, and Nested Data
String predicates can require significant decoding, allocations, and pattern-matching work. Regular-expression complexity depends on the supported engine and expression form. Array functions may expand row cardinality when unnested; nested fields retain structural constraints. Measure the number of generated intermediate rows and whether selective filters can be pushed down into the storage reader.
Regular expressions, substring operations and variable-length array functions can dominate CPU even when storage I/O is minimized. A map or nested JSON field that must be parsed repeatedly may justify extracting commonly queried attributes into typed columns. Array expansion can multiply logical row counts and change the meaning of aggregates. UTF-8 byte counts and Unicode character counts are not interchangeable for multilingual text. Use small reference inputs with empty arrays, missing keys, nulls and non-ASCII strings when validating SQL expressions.
18.3. sum, avg, count, min/max, and argMin/argMax
Simple sums and counts are mergeable partial states; an average should be computed from sum and count rather than by averaging subgroup means. argMin and argMax select associated values according to an ordering expression, but ties may require an additional deterministic key. Distinguish null handling and input type promotion. Aggregates must be evaluated at the declared fact grain.
argMin and argMax return an associated value selected by an ordering expression, not necessarily the overall minimum or maximum of the returned value itself. Ties require explicit handling if deterministic results are mandatory. SUM and COUNT can merge exact partial results over disjoint partitions, while averages require both sum and count or a supported aggregate state. Grouping by mutable labels can change historical results independently of the underlying events. Store stable grouping keys and apply versioned dimension names according to the report's temporal rule.
18.4. Variance, Standard Deviation, Covariance, Correlation, Skewness, and Kurtosis
Sample and population estimators have different denominators. Some formulas are numerically unstable when using the difference of large squared sums; stable stateful algorithms can reduce cancellation errors. Distributed covariance and higher moments require carefully mergeable intermediate statistics. Document expected null handling, outliers, units, and whether the requested output is sample- or population-based.
Sample variance and population variance have different denominators and should be selected according to the statistical question. Covariance and correlation can become unstable for degenerate samples; a constant variable has undefined Pearson correlation. Skewness and kurtosis estimates are sensitive to outliers and small sample sizes. Online aggregate states can compute some statistics without retaining every source value, but numerical stability and merge behavior must be checked. A precise SQL function name is part of the mathematical definition, not a cosmetic implementation detail.
18.5. quantileExact, t-digest, uniq/uniqExact, and topK
Exact quantile and distinct-value functions can consume memory proportional to input or cardinality. Approximate sketches trade bounded resources for estimation error, but the error distribution depends on algorithm, data distribution, and parameters. topK summarizes frequent values and may not be an exact ordered frequency table. State accuracy requirements explicitly before changing algorithms for performance.
SELECT
    service_id,
    count() AS n,
    avg(duration_ms) AS mean_ms,
    quantileExact(0.95)(duration_ms) AS p95_ms,
    max(duration_ms) AS max_ms
FROM events
WHERE event_time >= now() - INTERVAL 1 DAY
GROUP BY service_id
ORDER BY p95_ms DESC;
Approximate quantiles and distinct-count functions expose different accuracy–memory tradeoffs. quantileExact must retain enough information for an exact order statistic and can require substantially more memory than a compact sketch for high cardinalities. TDigest represents a distribution through centroids and approximates quantiles with accuracy that depends on data shape and implementation. Do not treat a reported p99 from a histogram or sketch as a statistically exact value. uniqExact counts unique keys exactly at the cost of maintaining potentially large state, while approximate alternatives exchange deterministic exactness for bounded or tunable resource use. topK is a candidate heavy-hitter algorithm, not necessarily a proof that no omitted key is more frequent under arbitrary distributions. Validation compares results against exact functions on representative samples and reports both absolute and relative error.
An approximate result should be accompanied by a validation procedure. For selected datasets, compare quantileExact and a TDigest-based quantile across several percentiles and report absolute latency error as well as rank or relative error. For distinct counting, compare uniqExact to supported approximate functions over low, moderate and high-cardinality groups. Skew and repeated values can change empirical error behavior. Exact aggregation may exceed an interactive server's memory budget at extreme cardinality, in which case approximate states can support dashboards while exact counts are generated through bounded offline batches. Persist the function definition and parameters alongside long-lived aggregate states.
18.6. If, State, Merge, and MergeState Combinators
Aggregate combinators modify condition handling and the representation of partial state. A state stored by ...State must be read through the compatible merge/finalization operation. States from incompatible functions or parameterizations cannot be freely combined. Conditional partial aggregates can implement efficient filtered metrics, but grouping grain and replay behavior still determine correctness.
Aggregate combinators modify functions in defined ways: conditional variants restrict contributing rows, state variants preserve mergeable intermediate information, and merge variants combine those states. An aggregate state is not equivalent to the scalar result displayed by a finalized query. Mixing states from incompatible parameters or types can yield an error or incorrect interpretation. For reproducible distributed summaries, maintain a stable schema of state types and verify that the finalization functions match the producer functions. This matters particularly for quantiles and approximate distinct calculations.
18.7. Window Functions, Retention, Funnels, and Time Bucketing
Window functions calculate results over ordered partitions without necessarily collapsing the input to one row per group. Retention and funnel computations require explicit user identity, event ordering, and attribution windows. Time bucketing depends on event time, time zone, and daylight-saving behavior. Tie-breaking and late arrivals are essential for reproducible sequential analyses.
Retention cohorts require an unambiguous population and reference event. If a cohort starts with users active on day zero, day-seven retention usually counts cohort members with a qualifying activity in the specified later window divided by the original cohort population. An event that arrived late but occurred on day seven should affect the same historical cohort when event-time semantics are intended. Funnel analysis additionally requires ordered stages, optional timeouts, and treatment of repeated events. Arbitrary ingestion-order sequences can inflate or suppress conversions.
SELECT
    service_id,
    toStartOfInterval(event_time, INTERVAL 15 MINUTE) AS bucket,
    count() AS events,
    sum(bytes_sent) AS bytes
FROM events
WHERE event_time >= now() - INTERVAL 1 DAY
GROUP BY service_id, bucket
ORDER BY service_id, bucket;
Window functions operate over a declared partition and ordering without necessarily collapsing each input row into one grouped result. A moving average needs an explicit frame; otherwise the default frame may not match the intended business interval. Retention analysis relates cohorts across time and should define whether repeated events from one user count once or multiple times. Funnel analytics requires an event ordering and a treatment of simultaneous or missing steps. Time bucketing must declare the time zone and whether interval endpoints are inclusive or exclusive.
18.8. Error and Memory Costs of Approximate Algorithms
Compare algorithms using absolute or relative estimation error, confidence over repeated samples, and memory under high cardinality. No finite summary guarantees equal fidelity for every possible distribution. Mergeability enables parallelism but may alter estimator behavior relative to one global pass. Validate approximate counts against exact subsets and report error at the level relevant to the application.
For a classical Bloom filter used as a membership test, the approximate false-positive probability is p ≈ (1−e^(−kn/m))ᵏ, where n is the number of inserted keys, m is the bit count, and k is the number of hash functions. This does not supply a false-negative probability for a correctly constructed filter; positive responses merely require data validation. Approximate cardinality and quantile structures instead have different statistical error models. Do not transfer a Bloom-filter equation to an unrelated sketch.
[48]
Quantile error should be assessed at the percentile of interest, not only at the median. In a long-tailed latency distribution, a small rank error around p99 can correspond to a large difference in milliseconds. Repeat measurements across data distributions, cardinalities and shuffled insertion orders; the shape of the sketch may respond differently to these factors. If a dashboard requires a hard threshold decision, distinguish a statistical estimate from an exact compliance measurement. Track algorithm version and aggregate-state compatibility when persisting states long term. Approximate cardinality sketches merge across shards efficiently, but duplicate semantics and hash collisions must still be considered when interpreting error guarantees.
18.9. PRQL, KQL, LogsQL, and Alternative Query Languages
Alternative syntaxes or dialects can lower adoption costs for certain analyst workflows but remain product- and release-specific. A dialect adapter may not reproduce all source-language semantics. Classify each feature as stable, beta, or experimental for the tested version. Security review should focus on the executed operations after translation, not on the surface query language alone.
FROM events
|> WHERE service_id = 42
|> AGGREGATE count() AS event_count GROUP BY status_code
|> ORDER BY event_count DESC;
[41] [46]
Alternative query syntaxes such as PRQL, KQL or LogsQL should be separated from ClickHouse SQL's core grammar and from optional translation or integration layers. A syntax described in a product announcement may be experimental or supplied through a specific client rather than accepted by every server version. Define the translated SQL semantics, parameter binding and security context before treating a dialect adapter as interchangeable with native SQL. In particular, text-search expression languages and analytic relational languages have different data models; spelling similarity does not imply compatible filter behavior. Include an explicit supported-version and settings requirement for each nonstandard syntax example.
A query-language translator can be assessed through a three-stage test: parser acceptance, translation to SQL, and equivalence of results on a constructed dataset. Include null values, duplicate records, nested fields, escaped strings and time-zone boundaries. A translated query may preserve a filter's shape while changing the treatment of missing fields or tokenized text. Resource and authorization settings applied to the generated SQL also matter, since otherwise a convenient alternate language could bypass intended application-level controls. The supported surface must be recorded for the actual server and client versions.
Unit 19: JOIN Algorithms and External Dictionaries
JOIN cost is not determined by row count alone. Hash-table memory, sorting work and data distribution influence which algorithm is appropriate.
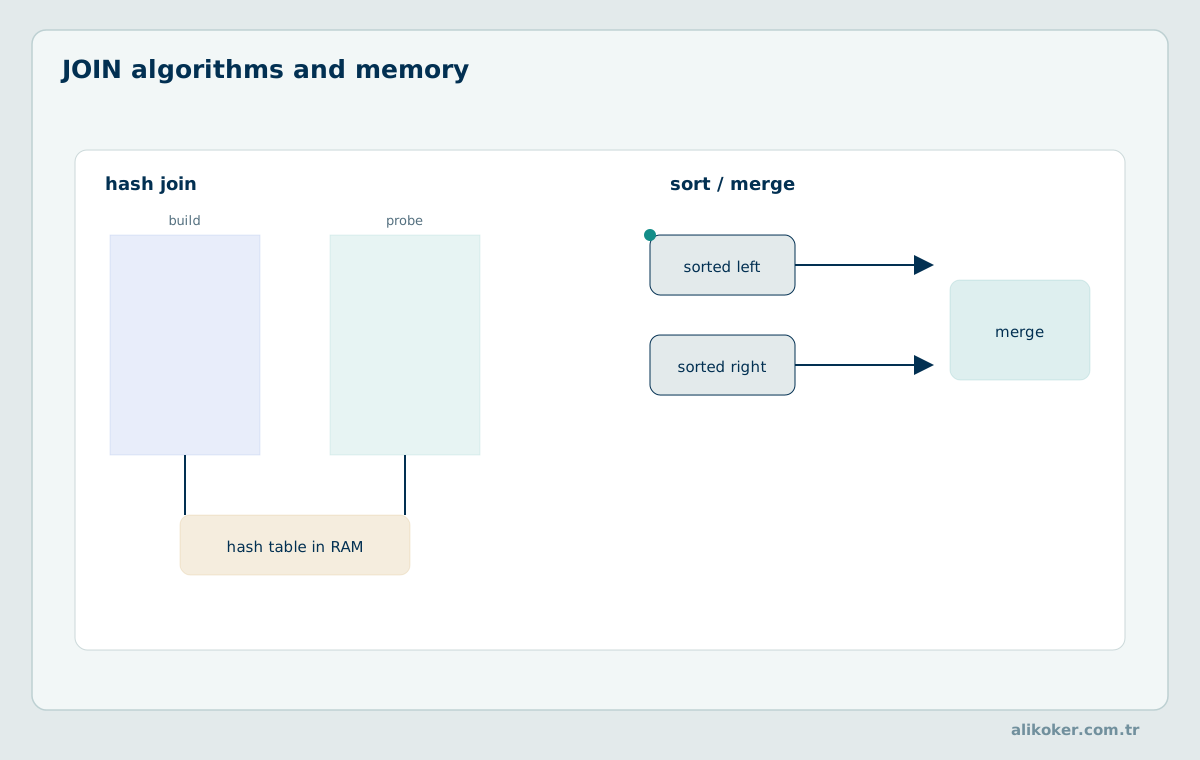
Join performance depends on input size, key distribution, ordering, join kind, available memory, and the cost of shuffling rows across machines. A single query planner may choose among hash-based, sorting-based, and lookup-based algorithms. Result multiplicity and null/tie behavior must be preserved when an algorithm or physical model changes.
19.1. ALL, ANY, SEMI, ANTI, and ASOF JOIN Variants
ALL preserves matching multiplicity; ANY selects a matching representative according to the engine's semantics and should not be used when every match matters. SEMI and ANTI express existence and nonexistence logic without generating all matching right-side rows. ASOF joins associate events with suitable ordered states, which is valuable for time-aligned streams. Tie-breaking, incomplete intervals, and null keys require explicit correctness tests.
[41]
ALL preserves matching multiplicity; ANY limits the join-side match interpretation under its supported semantics. SEMI and ANTI represent existence and nonexistence conditions, while ASOF selects an appropriately ordered nearest prior or otherwise qualifying value according to its predicate. These are not interchangeable performance hints. An event joined against multiple overlapping dimension versions can multiply facts unless a unique temporal match is guaranteed. Construct cases with duplicate keys, nulls and equal timestamps to validate the chosen JOIN type. A syntactically fast query producing the wrong row multiplicity is not a valid optimization.
19.2. Hash, Partial/Full Sorting Merge, Direct, and Grace-Hash JOIN
Hash joins build a lookup structure from one side and probe it with the other. Sorting-merge joins exploit or create ordered inputs; grace-hash approaches partition data to manage memory pressure. Direct joins rely on suitable key-value lookup facilities and eligible semantics. Choose by measured data size, cardinality, sort order, and memory ceiling rather than by a universal ranking of join algorithms.
[41]
Hash joins usually construct a lookup table from one input and probe it with the other; their primary memory risk is the size of the build side and the amplification from duplicate keys. A direct join can exploit an appropriate key-value source without building a new full hash table, but only when the join type and engine support this access pattern. Partial-merge and full-merge joins sort or exploit sorted streams, moving the cost toward comparisons and sequential I/O. Grace hash join partitions inputs to reduce peak in-memory state, potentially requiring spill files and extra passes. No one algorithm minimizes both memory and elapsed time for every distribution. For example, an extremely skewed key can create a large probe output even when the hash table is small. Compare build bytes, peak memory, spilled bytes and actual output cardinality under the desired ALL, ANY, SEMI, ANTI, or ASOF semantics. A merge join's performance depends on ordering assumptions; a hash join's expected complexity depends on hashing behavior and collision management. Indexing, dictionaries and pre-denormalization should be evaluated as alternatives when identical reference joins dominate a workload.
For a many-to-many hash join, the output cardinality may be much larger than either input even when lookups are individually efficient. If a join key appears 1000 times on the build side and 2000 times on the probe side, that key alone may generate two million joined rows under ALL semantics. No hash-table improvement eliminates the cost of materializing the requested result. ANY semantics can cap one side's multiplicity but change the answer and are not merely an optimization switch. An ASOF join instead selects a version according to ordering constraints, requiring disciplined handling of temporal boundaries and ties.
A grace hash join introduces a partitioning stage so that portions of the build relation can fit within a bounded memory budget. The tradeoff is partition I/O, possible repartitioning of skewed buckets and repeated passes. A full sorting/merge strategy can exploit physically ordered inputs or pay to sort them first; the latter cost may dominate one-off joins. A direct dictionary-like lookup can avoid a large build phase for keyed reference enrichment, but only when its supported semantics match the desired join. Compare not only the selected algorithm but its measured build/probe rows, intermediate bytes and spill behavior. The right design may instead pre-enrich events at ingestion if the dimensions are stable and historical corrections do not require repeated rewrites.
19.3. Hash-Table Construction, Probing, Cardinality, and Memory
For B rows on the build side and s bytes per entry, memory is at least on the order of B×s, often substantially more after buckets, pointers, alignment, and payload. Hash collisions and skew affect probe cost and cache locality. A many-to-many join can expand the output far beyond either input. Compare peak RSS and allocated bytes with input and result cardinality.
A 50-million-row hash-join build side with an optimistic 24 bytes per retained entry already accounts for about 1.2 GB of payload and key-related data. Bucket arrays, hash metadata, alignment, allocator fragmentation, and concurrent hash tables can make peak memory substantially larger. If the join creates multiple matches per probe key, output cardinality may dominate the remaining pipeline. A comparison with a merge join must include any required sorting and its temporary storage; sorted physical layouts can be decisive.
[41]
An in-memory hash join allocates a build-side table containing key representations, payload references and overhead for buckets or collision management. Peak memory can exceed the raw compressed size of the build input substantially, especially with strings and duplicate keys. Probe cost depends on hash distribution and memory locality, not only asymptotic O(1) expected lookup. When joins spill or repartition, CPU and disk/network traffic increase. Favor smaller build sides where semantics and the optimizer allow it, and confirm the actual algorithm through EXPLAIN and query memory counters.
19.4. External Dictionaries: Layouts, Sources, Refresh, and Caching
Dictionaries map keys to attributes and can use layouts optimized for different key types and update patterns. Reload frequency, expiry rules, and lookup latency determine the risk of stale enrichment. A dictionary can reduce join overhead but does not create transactional consistency with the source dimension. Account for key misses, default-value behavior, refresh failures, and source availability.
[46]
External dictionaries can implement low-latency enrichment against compact reference data without materializing a general-purpose join for every query. Dictionary layouts differ in key handling, memory footprint and lookup method; cache-oriented layouts additionally expose refresh and stale-value behavior. The authoritative source must be identified, and invalidation or periodic reload policies must match the acceptable analytical delay. A missing key can map to a configured default, which can silently affect aggregates if not handled deliberately. Measure dictionary hit rate and loading cost with the same key distribution as production; a benchmark using entirely warm lookups can conceal upstream dependency latency.
19.5. Key-Based Enrichment with dictGet
dictGet retrieves dictionary attributes by key and can simplify frequently repeated dimension lookups. Verify the key's type and whether a missing key is distinguishable from a legitimate default value. A large scan can still trigger enormous numbers of lookups, potentially saturating a remote dictionary source. Use appropriate in-memory layouts and measured hit/miss behavior.
dictGet retrieves attributes from a configured dictionary keyed by one or more identifiers. It can reduce join-building overhead for repeated lookups, but missing-key defaults and cache-refresh intervals have correctness implications. A dimension correction may be visible in the source before the dictionary reloads. Define acceptable staleness and whether a missing key should raise an error, return a sentinel or exclude a result. Benchmark with both warm and cold key distributions; a fully cached dictionary test understates external data-source dependency costs.
19.6. Denormalization and Materialization Instead of JOIN
Embedding stable dimension attributes in facts avoids per-query joins but increases ingest and correction costs. A materialized representation can trade write amplification and freshness lag for low read latency. When dimensions change historically, naive overwrites violate point-in-time analysis. Quantify correction frequency, projected query savings, and the cost of reconstructing derived rows.
Denormalizing a reference field into an event table eliminates repeated runtime joins, but a changing reference value then requires either historical version interpretation or backfilling the affected events. Precomputing a view can help a stable reporting workload yet introduces write and recovery overhead. A static lookup of service metadata differs fundamentally from an as-of lookup into slowly changing customer classifications. Evaluate the cardinality of reference keys, update rate and impact of corrections before choosing query-time JOIN, dictionary lookup or copied attributes.
19.7. Cross-Shard JOIN and Distributed Merge Semantics
A distributed join may broadcast a small relation, repartition rows by key, or execute local joins under stronger data-placement assumptions. Network bytes and coordinator memory can dominate compute time. A local JOIN on shards is only equivalent to a global JOIN when key placement and reference data satisfy the required invariant. Document co-sharding assumptions and cross-shard failure handling.
A colocated join is safe only when every pair of rows that may match is routed to a common shard or the necessary reference side is available to each shard. Hashing the left table by tenant and the right table by customer does not satisfy that invariant even when the SQL join uses customer ID. A local join can then omit valid matches without appearing to fail. A distributed/global strategy may recover correctness but pay network and memory costs. Test a deliberately cross-shard fixture before relying on local execution for production reports.
Application-side data access, concurrency, and query efficiency are also analyzed in High-Performance Java Data Systems.
Distributed JOIN behavior depends on whether each shard has the necessary reference rows or must exchange them. Broadcasting a small dimension can be economical; broadcasting a large fact table usually is not. Repartitioning inputs by join keys can impose network transfer comparable to the input sizes, and skewed keys can overload one destination shard. GLOBAL and other distributed join options affect the execution strategy and must be evaluated using query plans. A correct local join on one shard does not prove the equivalent global query returns all relevant cross-shard matches.
Unit 20: Query Planning, Optimization, and Parallel Execution
Parallel execution distributes multiple read streams across filters and aggregators; speedup eventually meets merge points and shared-resource limits.
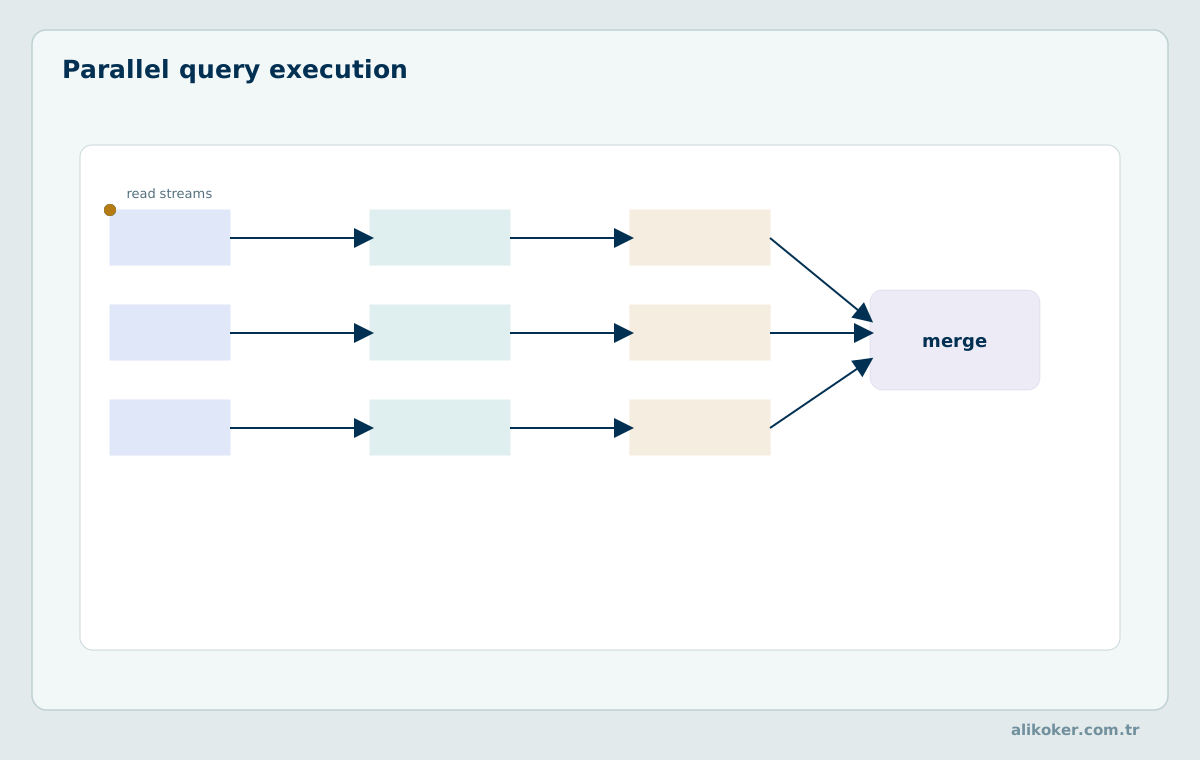
SQL syntax passes through parsing, semantic analysis, logical optimization, and execution planning before any user-visible result is returned. Physical pipelines overlap scans, filtering, aggregation, and exchange when resource availability permits. Explain plans must be interpreted against the exact version and settings used to generate them.
20.1. Parsing, Semantic Analysis, and Logical Plans
Parsing recognizes language constructs; the analyzer resolves identifiers, types, aliases, and expression scope. Logical rewriting can push filters, remove unnecessary expressions, or reorder eligible operations without changing semantics. Incorrect implicit conversions may change output before the optimizer can improve performance. Use small result-equivalence tests to validate migrations between SQL dialects.
Parsing SQL produces syntax structure; semantic analysis resolves names, types and valid expressions; planning determines operators and their relationships. The optimized plan may not resemble the textual order in which clauses were written. A selective filter can be pushed closer to the read stage, an expression may be reused or folded, and joins can be reordered when semantics permit. Version-dependent analyzer capabilities matter: a query that parses successfully may still have a suboptimal physical plan, while a query rewrite might alter behavior under nondeterministic expressions or null handling. Use EXPLAIN AST, EXPLAIN PLAN and EXPLAIN PIPELINE for distinct questions instead of treating them as interchangeable debugging views.
20.2. EXPLAIN AST, PLAN, and PIPELINE
An abstract syntax tree exposes parsed and analyzed expressions, a query plan describes logical/physical operations, and a pipeline shows runtime processors and connections. They answer different diagnostic questions. Some optimizations are conditional on release, settings, or statistics. Pair explain output with profile counters because a plausible plan does not establish its actual runtime cost.
EXPLAIN indexes = 1
SELECT service_id, count(), sum(bytes_sent)
FROM events
WHERE service_id = 42
  AND event_time >= toDateTime64('2026-10-27 00:00:00', 3, 'UTC')
  AND event_time < toDateTime64('2026-10-28 00:00:00', 3, 'UTC')
GROUP BY service_id;

EXPLAIN PIPELINE
SELECT service_id, count(), sum(bytes_sent)
FROM events
WHERE service_id = 42
  AND event_time >= toDateTime64('2026-10-27 00:00:00', 3, 'UTC')
  AND event_time < toDateTime64('2026-10-28 00:00:00', 3, 'UTC')
GROUP BY service_id;
[11] [16]
EXPLAIN AST describes parsed structure, EXPLAIN PLAN describes planned relational operations, and EXPLAIN PIPELINE exposes processor execution structure. None alone is an elapsed-time measurement. A plan showing predicate pushdown suggests possible pruning; actual selected marks and read bytes prove how much was avoided. Reproduce settings and server version because analyzer behavior and available operators can change. Compare the same query under equivalent schema and data distributions before attributing a plan difference to one optimizer rule.
20.3. Processors, Ports, and Chunk Flow in Pipelines
Processors receive chunks, transform them, and pass them through ports to downstream stages. Multiple streams allow concurrent scanning and partial aggregation before states are merged. Pipeline narrowing under heavy load can reduce state duplication and memory while improving aggregate throughput. Parallelism should therefore be treated as a resource-allocation decision, not an unconditional speed multiplier.
[41]
Execution processors receive chunks through ports and pass results onward. Sources read or synthesize blocks, transforms filter, group, sort or project them, and sinks serialize or forward results. Multiple pipelines can run in parallel until a merge or global order imposes synchronization. Backpressure is necessary when a downstream consumer is slower than producers; otherwise temporary chunks accumulate and inflate memory usage. An operator's theoretical row-processing cost is insufficient to predict a pipeline's behavior when it waits on network delivery or disk reads. Distinguish waiting time from active CPU time in a query profile and inspect the number of participating processor instances when judging thread utilization.
20.4. Predicate Pushdown, Column Pruning, and Expression Optimization
A selective predicate may be evaluated while reading storage blocks, allowing later columns to be skipped. Column pruning removes fields not required by downstream operators. Expression simplification and constant folding reduce repeated computation. Whether a predicate is eligible for pushdown depends on function semantics, metadata availability, and query structure; EXPLAIN and read counters provide evidence.
[41]
Predicate pushdown reduces intermediate rows when a condition can be evaluated near the input, while column pruning removes unreferenced fields. Expression simplification or constant folding can reduce CPU work but does not automatically reduce disk I/O if the physical sort order provides no useful clustering. Null semantics and nondeterministic expressions may limit safe transformations. Use read bytes and selected granules to determine whether an optimization changed physical access or merely shortened a downstream processing stage.
20.5. Parallel Reads, Aggregation, and Data Exchange
Independent read streams produce partial group states that can be combined when the aggregates are mergeable. High-cardinality grouping may cause excessive hash-state duplication across workers. Distributed exchange requires serialization and transmission of rows or states. The best plan minimizes total system resources while achieving an acceptable response-time objective, not necessarily the fastest isolated scan.
[46]
Parallel scans can split mark ranges among workers, followed by partial aggregation and a final merge. The global final stage may become a bottleneck if group cardinality is very high or the query requires a full ordering of all results. Across nodes, sending intermediate aggregate states is often cheaper than sending all raw rows, provided the aggregate is mergeable. Query time includes synchronization and remote exchange; a cluster with uneven shard sizes can finish only as quickly as its slowest necessary worker.
20.6. SIMD, Multicore Processing, JIT, and Multinode Execution
SIMD accelerates selected vector operations, CPU threads process independent ranges, and distributed workers execute shards or partial plans. JIT or compiled-expression paths may be available only under certain conditions and releases. Network exchange and final merging introduce serialized work. Benchmark each mechanism separately, avoiding the assumption that a high thread count ensures high efficiency.
Multicore execution distributes work among threads, SIMD accelerates suitable operations within a thread, and distributed execution adds network-connected nodes. JIT compilation, where available, targets particular expressions and has compilation overhead that may not be justified for short requests. These mechanisms operate at different levels, so their speedups are not simply multiplied. A memory-bound filter can remain limited by shared bandwidth even when more SIMD lanes and worker threads are available. Identify the critical path rather than assuming maximum parallelism yields minimum latency.
20.7. Cost, Speedup Limits, and Workload Isolation
Latency improvements may result from fewer bytes read, less CPU work, lower memory allocation, or narrower network exchange. These improvements do not combine multiplicatively without considering the actual bottleneck. In mixed workloads, per-query parallelism competes with concurrent requests. CPU time, wall-clock latency, queuing, and peak memory should be reported together.
Query latency can be decomposed into input reading, decoding, transformation, aggregation, exchange, synchronization and output serialization. Parallelism reduces only the parallelizable portions, while adding overhead and competing for memory and I/O. Resource isolation can improve latency predictability under mixed workloads even if it reduces a single query's peak throughput. Compare measured service percentiles at fixed offered load; a benchmark of isolated queries does not characterize contention in a shared production server.
At fixed data size, adding workers can improve throughput while degrading p99 because additional concurrent pipelines increase contention on memory bandwidth and disk queues. A workload-isolated pool can protect a short dashboard query class but might leave fewer resources for long batch queries. The selection should be based on a stated service objective and arrival distribution. Measure completed-query latency, queue wait, peak memory and server error rate together; acceleration of one operator does not establish an improvement to total service response time.
20.8. Diagnosing Bottlenecks Through Query Plans
Start with a correctness-verified baseline, then inspect plan shape, marks read, rows examined, memory, and profile events. Distinguish expensive scanning from expensive grouping, joins, sorting, or output transfer. Apply one controlled physical change at a time and rerun with cold and warm caches. A plan that improves one query may degrade ingest or other common workloads.
For a slow grouped query, inspect whether the main cost occurs before or after aggregation. If the read stage scans most granules, change storage sorting or add an appropriate selective projection; if the scan is narrow but a high-cardinality hash table dominates, examine memory and grouping-state layout. If the plan transfers millions of partial groups to a coordinator, network exchange may be the bottleneck. The optimization action must follow the measured stage, since adding an index cannot fix an expensive final sort over a large result set.
A plan diagnosis should proceed from physical evidence: unexpected full scans indicate inadequate pruning, large hash states indicate grouping or join cardinality, and substantial network exchange suggests a nonlocal distributed operation. Check active parts and cache state before concluding that an index is ineffective. If a query returns ten rows but reads billions, the problem may be physical selectivity rather than output serialization. Capture one query ID and correlate plan output with logged read rows, elapsed time and peak memory.
Unit 21: Materialized Views, Projections, and Precomputation
Precomputation moves repeated analytical work from query time to ingest time. The query benefit must be weighed against extra write and storage cost.
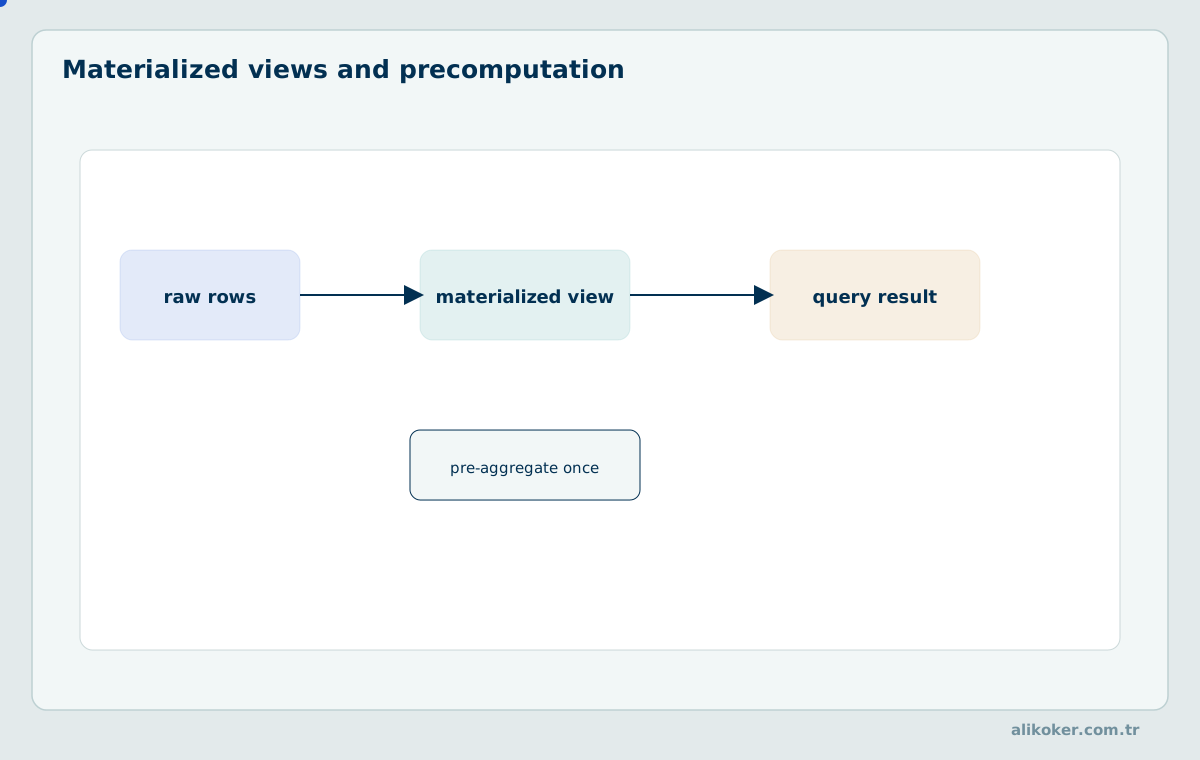
Materialized views and projections reduce repeated analytical work through additional maintained representations, but their correctness and lifecycle differ. A materialized transformation may see insertion batches rather than an automatically reconstructed global historical state. Late corrections and backfills therefore require explicit design.
21.1. Normal versus Materialized View Semantics
A normal view stores a query definition and evaluates it when accessed. Materialized forms maintain data derived from ingestion or scheduled refresh, depending on the feature and release. Results may lag or incorporate different update events than the base source. Define precisely when the derived state becomes visible, how it is backfilled, and how it is checked for source parity.
A normal view is a stored query definition evaluated against its sources when read. An incremental materialized view changes destination state as new source blocks arrive, while refreshable views rebuild results using a different scheduling model. These forms have different freshness, cost and correction semantics. A view definition does not universally preserve source transaction boundaries across several tables. Validate dependency behavior under late updates, deletes and interrupted backfills before relying on a view for financial or forensic reconciliation.
21.2. Incremental and Refreshable Materialized Views
An incremental materialized view commonly processes new insertion blocks; it does not necessarily propagate arbitrary source mutations as a fully transactional change stream. A refreshable view recomputes or refreshes derived data according to schedule and implementation. Later releases introduce additional incremental refresh facilities. Compare their source visibility, failure, and restart semantics rather than treating all materialized views as interchangeable.
Insertion-triggered materialization is naturally aligned with append-only events because each new block can update a derived aggregate. A source UPDATE that rewrites existing rows does not necessarily generate an equivalent compensating insertion into the derived target. For mutable sources, a correct design may emit explicit retract/add events, periodically refresh the affected summary, or build version-aware aggregation. Choose a method according to source correction frequency and the required freshness. A refresh schedule alone does not guarantee that the derived result was computed from a transactionally consistent cross-table snapshot.
Incremental materialized views react to inserted blocks and maintain target data as those blocks arrive. They do not automatically guarantee correction of prior results when a source row is later mutated, replaced or deleted. Refreshable materialized views recompute a query on a schedule or trigger and have different freshness, compute and replacement costs. If a transformation is not associative, merely appending new partial scalar results may not reproduce a global exact result. When building a view over an already populated source, define a handover point between historical backfill and live ingestion to avoid omissions and double counting. Maintain reproducible source offsets or event identifiers to validate completeness after a restart.
21.3. APPEND, REPLACE, and Cascading Views
Refresh behavior can append new results or replace a target representation according to configured semantics. Cascading views pass derived inserted data to further stages, creating a dependency chain. Intermediate failures and at-least-once replay can duplicate contributions unless the design supports idempotency. Document the intended correction strategy and processing boundary for every stage.
Append and replace behaviors of a refresh process differ in how readers observe previous results during rebuild and failure. A chained materialized view introduces a dependency graph: an upstream ingestion retry can lead to downstream duplicate processing unless the pipeline is designed around replay semantics. Avoid building chains that cannot be reconstructed from a preserved raw layer. A correction arriving out of event-time order may require recomputing several derived windows. The validation strategy should compare both counts and representative state values through each transformation boundary rather than checking only whether view tables exist.
21.4. Aggregate States and Summing/Aggregating Merges
AggregatingMergeTree can hold mergeable state rather than finalized scalar results. Finalization must occur at the correct grouping level. For an exact average, store and combine sum and count; for approximate distinct counting, merge the compatible sketch state. Incorrectly aggregating already finalized values can produce subtle errors that pass simple small-data tests.
CREATE TABLE hourly_event_stats
(
    bucket DateTime('UTC'),
    service_id UInt32,
    event_count AggregateFunction(count),
    duration_avg AggregateFunction(avg, UInt32)
)
ENGINE = AggregatingMergeTree
PARTITION BY toYYYYMM(bucket)
ORDER BY (service_id, bucket);

CREATE MATERIALIZED VIEW hourly_event_stats_mv
TO hourly_event_stats AS
SELECT
    toStartOfHour(event_time) AS bucket,
    service_id,
    countState() AS event_count,
    avgState(duration_ms) AS duration_avg
FROM events
GROUP BY bucket, service_id;

SELECT
    service_id,
    bucket,
    countMerge(event_count) AS n,
    avgMerge(duration_avg) AS average_duration
FROM hourly_event_stats
GROUP BY service_id, bucket;
[12]
SummingMergeTree merges additive numeric values for compatible keys, while AggregatingMergeTree combines function-specific aggregate states. An average is not correctly computed by summing group averages; retain sum/count or a supported average state. Distinct sketches must be merged as states rather than adding the final approximate counts. During incomplete background merging, query functions must combine all relevant parts correctly. The schema's sort key is a part of the aggregate grain and must not merge logically different groups.
21.5. Asynchronous Safety with Materialized Views
A buffered insertion and its derived materialized-view processing create multiple visibility boundaries. Some releases modify deduplication behavior for this path. Verify that replay does not double-apply an aggregate and that failure recovery preserves intended processing. Use controlled idempotent fixtures for tests; aggregate counts alone may obscure versioned duplicate events.
To test asynchronous ingestion, deliberately fail a client after submitting a batch but before receiving the acknowledgment, then retry with the same idempotency key. Check that the raw target and every dependent materialized view represent one logical event under the relevant version's deduplication rules. Repeat the test before and after a buffer flush. This exposes three distinct boundaries: client submission, durable table insertion, and downstream derived-state application. Claiming exactly-once behavior without all three tests is insufficient.
A materialized view fed by asynchronous inserts introduces another completion boundary. Even where block-level deduplication is supported, the logical identity of an application event may differ from a physical inserted block: the same records can be retried in a differently sized or ordered batch. The view may produce duplicate aggregate contributions unless upstream event IDs, processing keys, and target merge semantics are coordinated. Version-specific improvements in view deduplication do not justify declaring end-to-end exactly-once behavior across a producer, broker, source table and arbitrary view chain. Record a stable batch or event identity and build replay experiments that intentionally interrupt processing after the source acknowledgment but before all derived state is known to be complete.
Materialized-view processing should be tested with a producer that retries identical logical events in batches of different shapes. A block deduplication mechanism may recognize one exact replay but fail to identify a logically identical event repackaged with other records. Conversely, an application-level event key remains stable across batch reshaping. The correct design defines whether duplicate deliveries are suppressed before aggregation or whether downstream states compensate for them. Compare target tables against the original event identities and check their source commit watermarks after interrupted processing.
21.6. Projections and Automatic Selection
A projection stores an alternative internal organization or aggregate structure that the optimizer may select to serve eligible queries. It can improve pruning or avoid recomputation but increases storage and insert/merge work. Selection depends on query shape, optimizer settings, and release capabilities. Verify its use through explain plans rather than assuming every SELECT automatically benefits.
A projection maintains an additional physical arrangement or aggregate representation attached to a base table, and the optimizer may choose it for qualifying queries. Its presence does not guarantee every SELECT uses it. Selection depends on query shape, available parts and planner capabilities. Building projections incurs storage and background maintenance costs; some changes require materializing historical parts. Inspect the actual read plan and bytes rather than inferring use from a successful CREATE statement.
21.7. _part_offset-Based Projections
Lightweight projections that retain locating information such as _part_offset can help identify rows without duplicating all projected values. The benefit depends on the ability to use the projection for pruning and then fetch required columns efficiently. Additional lookups and physical I/O may reduce the advantage for broad scans. Verify feature support and explain output for the installed release.
_part_offset-based projections can provide alternate key lookup arrangements that refer back to base-part positions instead of duplicating every projected column. This can reduce the storage cost of certain secondary access paths but introduces dependencies on base part layout and merge maintenance. The optimization is not equivalent to a general OLTP secondary B-tree enforcing uniqueness. Verify supported versions, optimizer eligibility and how historical data is materialized. The right comparison includes read amplification, storage footprint and write-path overhead.
21.8. Materialized Views versus Projections
Materialized views usually expose separately managed derived targets and can support application-specific transformations. Projections are closely tied to a table's storage and optimizer. Different failure recovery, maintenance, backfill, and query-rewrite semantics follow. Choose based on operational ownership and correction requirements, not simply which feature yields a faster isolated benchmark.
A materialized view typically stores derived results in a destination table under an explicit transformation, whereas a projection represents an optimizer-visible physical organization associated with its source table. Both may accelerate queries but differ in maintenance, visibility and selection. An incremental aggregate view may need explicit correction handling for source mutations; a projection follows the underlying part lifecycle under engine rules. Choose based on required query semantics and maintenance cost, not merely on the fact that both can store precomputed data.
21.9. Backfill, Duplicates, and Reprocessing Correctness
A historical backfill can overlap with simultaneously arriving live events and double count them if source boundaries are not defined. Fix an immutable source watermark, ingest one side of the boundary into the historical path, and process the other through the live path. Deduplication must use stable source identities or versions. Validate both row-level and aggregate reconciliation after replay.
A safe historical materialization boundary is a source-defined immutable watermark W. Build the historical derived state from source events at or before W, then ingest and aggregate events after W through the live path. Overlap caused by retries must be resolved by stable event or transaction identities, not by arrival timestamps. Finally compare target aggregate states with independent source queries over both sides of W. Simply backfilling while an insertion-triggered view is active can count overlapping events twice.
Backfilling a materialized view while its source continues receiving data requires a strict boundary. One approach records a source offset or event-time cutoff, populates historical data up to it, and activates streaming processing after it. That boundary must be defined in source commit order when event arrival can be delayed; a simple timestamp predicate may overlap or leave gaps. Replaying a batch is safe only when the target representation has a compatible deduplication key or the old target range is replaced deterministically. Include delete and update events in the reconciliation plan. Compare sample keys, counts, and mergeable aggregate states rather than relying on total row counts alone.
21.10. Write Amplification, Ingestion Cost, and Query Benefit
Every additional maintained representation can require extra decoding, aggregation, index construction, and disk writes. The true benefit is saved query CPU and I/O minus incremental ingest and storage cost, including maintenance under concurrency. A projection or view may be excellent for a frequently repeated query but uneconomical for an occasional report.
Every additional index, projection or view consumes compute in the write path and may prolong background merge activity. If per-batch incremental maintenance takes more capacity than the steady incoming rate permits, an apparent query optimization becomes a system-wide ingestion bottleneck. Quantify benefits as Σ(query_frequency × latency_saved) against storage, CPU, correction and recovery costs. Dense projections can double selected-column storage, while _part_offset-style projections have different dependencies on base parts. A performance experiment should include simultaneous INSERT and SELECT workloads; measuring the latter in isolation can conceal the overall regression.
Unit 22: Data Updates, Deletions, and Transactional Consistency
ClickHouse updates and deletes do not behave like in-place OLTP row updates. Logical visibility and physical rewrite can occur at different times.
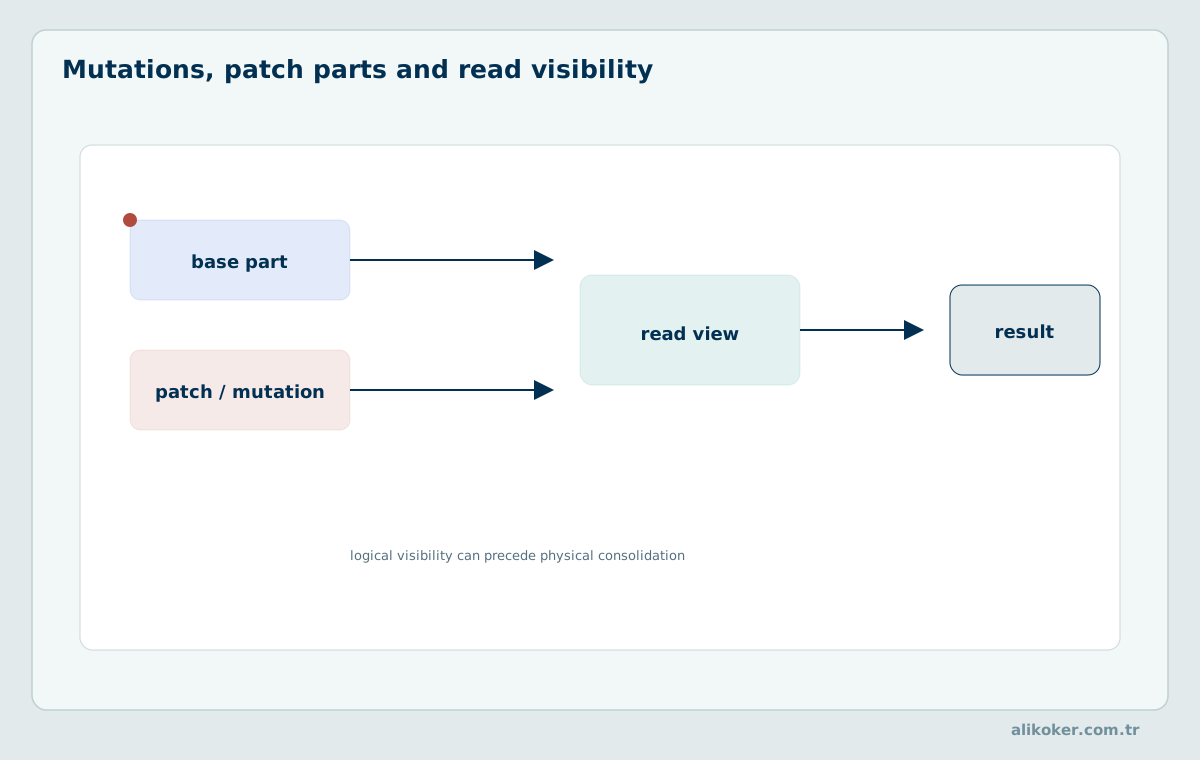
ClickHouse supports several mechanisms for changing data, including mutations, lightweight deletion, patch-based updates in eligible versions, and merge-time version replacement. These mechanisms have different atomicity, timing, and physical cleanup behavior from short-row OLTP transactions.
22.1. ALTER UPDATE/DELETE and Mutation Operations
Traditional mutation commands can rewrite affected data parts asynchronously. A submitted mutation may be acknowledged before all parts have been processed. Track progress and errors through system facilities and avoid assuming immediate physical completion. Cost is related to affected part sizes and concurrency, not merely the number of rows that logically satisfy the predicate.
Mutations can modify stored columnar parts under the selected engine's supported operations but are not a general OLTP transaction replacement. A request may enqueue work whose completion must be tracked separately. Updating a field that participates in a physical ordering contract has different implications from changing an ordinary payload column. Read-time consistency should be tested while the mutation is pending and after it finishes. Document which operations are synchronous, which are asynchronous and which are supported only in specific releases.
22.2. Lightweight DELETE, Patch Parts, and New UPDATE
Lightweight deletion can hide selected rows through delete masks while later consolidation removes physical data. Patch-based updates can avoid immediate full-part rewrites for eligible operations but introduce additional read and merge behavior. Feature support, default settings, and consistency guarantees change by release. Compare full mutation, patch update, and versioned append approaches under the actual workload.
Patch-based updates can be dramatically faster than traditional part-rewriting mutations for particular sparse-update workloads because they avoid immediately rewriting large unaffected column streams. But query reads may need to reconcile patches with base parts, creating deferred work. An experiment should therefore report update acknowledgment latency, subsequent SELECT latency, merge cost, and peak storage overhead. A vendor claim of a thousand-fold update speedup is a benchmark result under a specific setup, not a guarantee for frequent high-volume updates on every MergeTree table.
DELETE FROM events
WHERE event_time < toDateTime64('2025-01-01 00:00:00', 3, 'UTC');
Classic ALTER TABLE ... UPDATE and DELETE mutations rewrite affected immutable data in the background or under the configured execution model. Newer lightweight update mechanisms can represent changed columns using patch parts and defer physical consolidation; their performance depends on match selectivity, update width, ordering and system version. Logical row invisibility and physical byte erasure are different events. Similarly, a lightweight delete can hide records through masks before later merge cleanup reclaims space. Do not treat a successful mutation request as proof that sensitive bytes have been purged from every replica, detached part, snapshot or backup. A deletion policy must define the full storage lifecycle and verifiable completion criteria.
Patch-based lightweight updates can reduce unnecessary rewriting when only a few columns of a small fraction of rows change. If updates touch most rows or cluster poorly in physical order, patch lookup and consolidation may erase the expected advantage. A performance comparison must specify the modified-row fraction, columns changed, part layout, read-time overhead and background merge cost. Neither a patch nor a delete mask guarantees immediate physical erasure from backups or inactive parts. The target's logical read-after-update behavior must be validated at the desired consistency boundary.
22.3. ReplacingMergeTree Updates versus Physical UPDATE
Appending a later version into ReplacingMergeTree is a modeling choice; it is not a row update performed under a unique primary-key constraint. Old and new versions may coexist physically until merges or query-time resolution. The application must define whether deleted versions, version ties, and late arrivals are handled by its query pattern. FINAL can improve current-state interpretation but may increase resource consumption.
Append-and-replace updates encode successive logical states as new rows, with the highest applicable version selected at merge or query time. They avoid some immediate rewrite costs but impose query correctness requirements and possibly larger temporary storage. Physical mutation directly changes existing stored representations over time, subject to engine and visibility guarantees. Mixing these models without a defined version contract can produce non-deterministic results under retries. For instance, a later-arriving correction may have an older event timestamp but a newer source commit sequence; version precedence must be based on the intended logical ordering, not whichever timestamp happens to be convenient.
22.4. Consistency, Snapshot Isolation, and ACID Boundaries
Atomic insertion of a block or part cannot be generalized to arbitrary multi-statement transactions. Read visibility may be consistent for a table snapshot while an application observes different progress in other tables. Describe precisely which guarantees apply to the chosen engine and deployment. Requirements demanding serializable multi-table writes generally belong in the source OLTP system.
Consider a source Oracle transaction that inserts an order and updates an account balance. The CDC pipeline can materialize these changes in different ClickHouse target tables at different instants, even if each individual insertion is atomically visible. An analytical query that joins the two targets may briefly observe only one change. Define either an acceptable staleness bound or an explicit applied-source-transaction watermark for reports requiring cross-table consistency. This illustrates why storage-level insertion atomicity does not imply general multi-table serializability.
A single ClickHouse statement can provide useful atomic visibility guarantees within defined boundaries without supporting an arbitrary multi-table serializable transaction workflow. An analytical reader can still observe different source commit points in two target tables replicated independently through CDC. “Snapshot isolation” must therefore be scoped to the actual table, statement and engine behavior being discussed. Use explicit source watermarks or coordinated publication of completed analytical snapshots when cross-table reports demand a consistent boundary.
22.5. Multi-Table and Distributed Transaction Limits
A source transaction that changes several relations may be replayed through independent targets, views, and shards. The target cannot be assumed to expose all changes simultaneously without additional coordination. Build application-level read-consistency boundaries around source commit progress where needed. A distributed message broker does not automatically provide a distributed database transaction across unrelated storage engines.
Distributed inserts, several materialized-view destinations and a source Oracle transaction can have different commit and failure boundaries. A failed second step cannot automatically roll back every earlier target side effect. Avoid promising cross-shard atomicity without a documented protocol providing it. Reconciliation procedures should be capable of repairing one incomplete batch or logical transaction using a stable source identity. This design is more reliable than extrapolating an OLTP database's transaction model to an asynchronous analytic pipeline.
22.6. FINAL and Read-Visibility Guarantees
FINAL forces relevant merge semantics at query time for engines where supported. It can be necessary for correctness in current-version queries but requires extra comparisons or merging work. Predicates and partition behavior can influence correctness and cost. Benchmark typical queries and consider precomputed current-state representations when frequent FINAL becomes expensive.
FINAL requests finalization semantics for supported MergeTree engine behavior at query time, often to expose a logically resolved state across parts. It can raise CPU, memory and read work; it is not universally required or beneficial. A background merge may reduce redundant versions physically, but its completion time is not a fixed correctness deadline. For queries needing current deduplicated state, compare FINAL against explicit latest-version grouping strategies and validate results under duplicate and out-of-order updates. Do not add FINAL mechanically to every query.
22.7. Retention and Logical versus Physical Erasure
A delete that makes rows invisible does not necessarily guarantee immediate removal from every part, replica, object cache, or backup. Define deletion deadlines and verify the physical lifecycle of affected storage. TTL and partition drop are useful retention tools but may not cover every legal erasure requirement without backup expiration and operational controls.
A retention command's completion is not equivalent to secure removal of every historical copy. A deleted record may persist in inactive parts, replicas, filesystem snapshots, remote storage versions or backups until their respective lifecycles expire. For ordinary analytics, TTL-based partition expiration can be efficient when legal retention and partition granularity agree. For regulated erasure, document physical cleanup, backup expiry, restoration behavior and independent verification. The source system may also retain tombstones so that a later replay does not resurrect a deleted logical record. Without that replay rule, a seemingly successful target deletion can be undone during reconstruction.
22.8. Errors, Retries, Idempotence, and Validation
Every mutation path should have tests for interruption, replay, duplicates, ordering, and concurrent readers. A retry after network failure can be correct only if the operation's identity or effects are idempotent or safely reconciled. Compare source and target keys at a known watermark and inspect both logical results and physical parts when the lifecycle matters.
Error handling should be evaluated against the point at which the client can know an operation completed. A timeout after sending an INSERT does not establish that the server rejected it; blind replay may duplicate rows. A network interruption during a mutation likewise does not reveal the final background completion state. Use stable request or event identifiers where supported, inspect operation status, and define idempotent retry contracts. In integration tests, inject failure before request submission, after server acceptance, during background processing and after source offset advancement. Check both logical query results and physical part state at each boundary. Avoid equating “exactly once observed in one SELECT” with exactly-once source processing.
Unit 23: Distributed ClickHouse, Sharding, Replication, and Keeper
A distributed-query coordinator fans work out to shards; replicas provide redundancy inside each shard, and partial results are merged upstream.
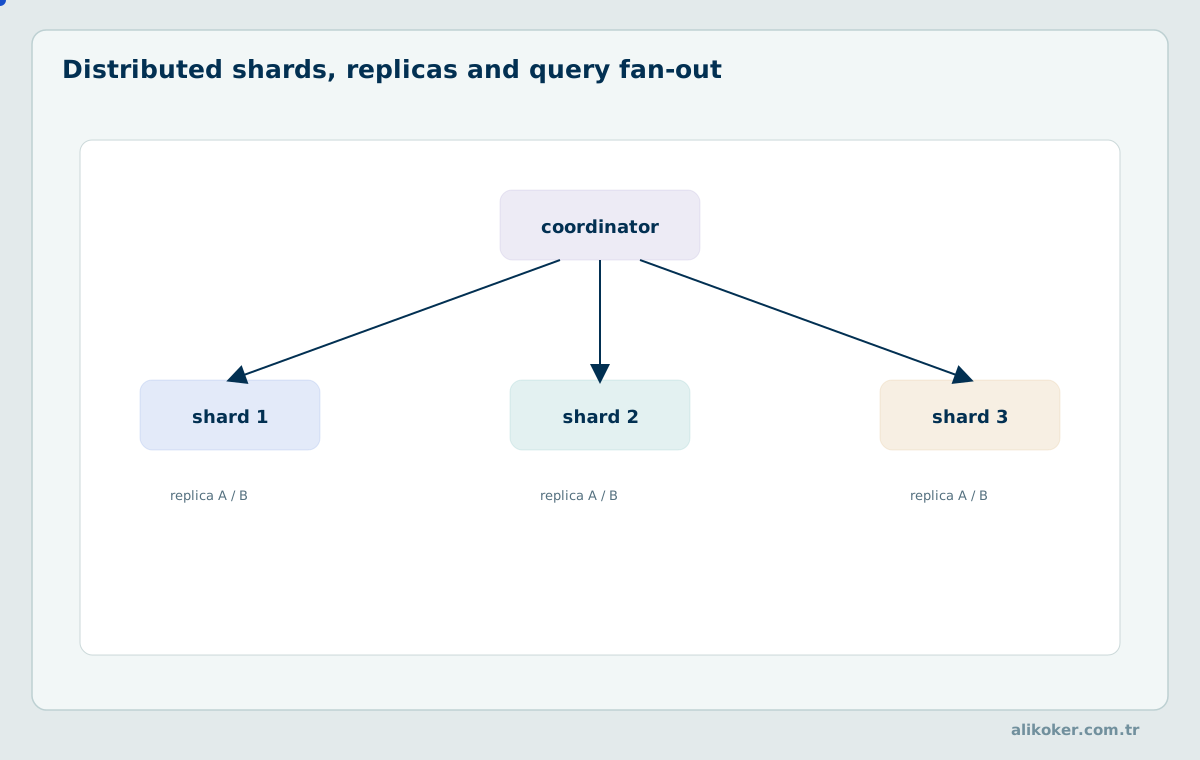
Distributed ClickHouse separates data placement across shards from data redundancy through replicas. Keeper coordinates metadata and replicated operations, but does not turn all arbitrary SQL into a distributed ACID transaction. Query correctness depends on routing, placement invariants, and failure policy.
23.1. Shards, Replicas, and Cluster Topology
A shard holds a logical subset of records; replicas hold copies of a shard's data. Increasing shards distributes computation and storage, while adding replicas can improve availability and read capacity at additional resource cost. Placement should reflect failure domains and routing behavior. Replica count alone does not express backup coverage or end-to-end consistency.
A shard partitions the logical dataset, while a replica stores a copy of a shard's data for availability and read capacity. Two shards with two replicas each produce four physical placements but only two logical partitions of records. A query routed through a Distributed table must avoid counting replica copies as independent facts. Topology should be designed around shard-key skew, replication delays, regional failure domains and the acceptable consequences of a coordinator outage. Include cross-shard network cost when adding nodes to improve aggregate query throughput.
23.2. ClickHouse Keeper, ZooKeeper, and Metadata Coordination
Keeper provides coordination facilities for replicated metadata and distributed operations. Correct cluster sizing and quorum affect both availability and recovery behavior. Keeper stores coordination state, not necessarily every user data byte. Backups and restore procedures must cover the relevant data and metadata boundaries independently.
ClickHouse Keeper coordinates replicated metadata and requires a quorum for operations that change the coordinated state. A three-member consensus group can normally tolerate one unavailable participant for quorum decisions; two simultaneous losses prevent new majority decisions. This is a coordination statement, not a guarantee that every SELECT across every shard remains available. Existing data on a healthy replica may still support some reads while writes or new coordination-dependent operations are blocked. Do not conflate Keeper leader election with a permanent single query leader or with application-level transaction coordination. Test isolated nodes, slow disks and partial network partitions while checking the exact read and write behavior supported by the deployment.
23.3. Leader Election, Quorum, and Replication Lag
A majority-based coordination group needs enough reachable voters to make progress. With 2f+1 voters, at most f failures can generally be tolerated for majority availability under the relevant failure model. This mathematical property does not guarantee that every database read is linearizable. Distinguish Keeper quorum from data quorum and per-replica freshness.
Quorum example: a coordination ensemble with five voting members ordinarily requires three reachable votes to commit under majority rules, tolerating at most two simultaneous failures for progress. This is a property of the coordination consensus group, not a promise that every query reads the newest application event. Data replicas may still be behind, and reads can be routed differently during failover. Keep consensus availability, shard replication lag, and application-visible completeness as three separately measured quantities.
Consensus quorum requires a majority of the configured Keeper participants for coordinated decisions. Leader election is a mechanism for maintaining that coordinated state; it does not grant one server permanent ownership of all analytical queries. Replication lag measures the distance between replicas and needs both temporal and queue-based interpretation. A source of apparent consistency can vanish under asymmetric network delay even when all machines are technically running. Test whether the deployment favors availability of certain reads or blocks writes when coordination is lost, and document those boundaries.
23.4. ReplicatedMergeTree and Part Replication
ReplicatedMergeTree coordinates data-part metadata and allows replicas to fetch or generate required parts. Replicas may lag, and part availability can differ during failover. Measure synchronization progress rather than assuming instant identical state. Replication protects availability against certain failures but also propagates logical deletes and is not a historical backup system.
SELECT
    database,
    table,
    replica_name,
    is_readonly,
    absolute_delay,
    queue_size
FROM system.replicas
ORDER BY absolute_delay DESC;
A replicated MergeTree table stores and exchanges parts across replicas in a shard under coordination metadata, but queries can still observe differing freshness while replication work remains outstanding. Replication is not a substitute for a backup: a mistaken delete, incompatible schema change or administrative action may propagate to every replica. Replica health should be assessed from delay, queues, read-only states, coordination availability, disk pressure and part checksums. The number of replicas affects availability, network transfer and storage cost, not the number of logical records counted in a properly distributed query. Recovery planning must specify whether a replica rebuilds from peer parts, durable storage, or an independently retained backup.
A replica that has caught up to the latest advertised replication queue position still requires data-part checksums and the expected table schema to be considered healthy. A failed part fetch may retry while queries continue against older available parts, producing read freshness differences. Service routing should define whether stale replicas are allowed and what happens when all replicas for one shard become unavailable. Recovering one replica from others may use substantial network and disk capacity; this cost must be included in recovery-time estimates rather than assuming replication is instantaneous.
23.5. Distributed Engine and Query Dispatch
The Distributed engine can route queries to shard-local tables and aggregate their partial results. Query plans may transmit rows or aggregate states, depending on operators and optimizer rules. Network and coordinator demand grow with intermediate-result cardinality. Record the choice of replica, query consistency assumptions, and the effect of unavailable shards on result completeness.
The Distributed engine routes reads and, under configured modes, inserts to underlying shard tables. Its logical name does not by itself constitute the durable physical storage for every event. Query settings can influence how remote results are gathered and aggregated. A service must know whether it can tolerate stale replicas, missing shards or partial remote failures. Verify the actual set of contacted hosts and response completeness; a syntactically successful SELECT should not conceal a partial cluster result when the application requires exact totals.
23.6. Cross-Shard Aggregation, JOIN, and Distributed DDL
Aggregations can combine partial states when their operations are mergeable. Cross-shard joins may need broadcasts or exchanges unless data is colocated by join key. Distributed DDL can take effect at different times across nodes, requiring progress checks. A partially applied schema change is a legitimate failure scenario requiring a recovery plan.
Distributed aggregations can reduce network traffic by combining mergeable states close to their source shards. A coordinator later combines partial results; for SUM and COUNT over disjoint partitions this can be exact, while DISTINCT and quantile queries require appropriate merge states. Shard-local limits or premature finalization can change the semantics of a global TOP-K. Cross-shard joins may broadcast small reference data or repartition larger inputs, consuming network and memory proportional to intermediate cardinalities. Distributed DDL is a coordination operation with asynchronous propagation and should be monitored for partial completion rather than assumed immediately identical on every node.
23.7. Failure Types, Partial Results, and Recovery
Node loss, network partition, disk failure, stale replica, and coordinator outage have different consequences. Under some configurations partial results may be returned rather than a complete dataset; report completeness explicitly. Recovery procedures should examine replication queues, part states, and available source replicas before forcing destructive repairs.
A network partition may leave an isolated node capable of serving a stale local read even though it cannot participate in the coordination quorum. An unavailable shard and an unavailable replica also have different impact: one replica may be replaced by another, while losing the only reachable replica of a shard can make the global query incomplete. A resilient client policy must distinguish error responses from explicitly permitted partial results. A backup remains essential for logical corruption propagated across all healthy replicas.
Failures include process crashes, full disks, corrupted part bytes, network partitions, lost coordination quorum and partial source replay. These events require different recovery procedures. Automatic replica catch-up addresses some node losses but cannot recover a logically incorrect delete propagated to all replicas. A distributed query that returns partial results may be unacceptable for financial or forensic reporting even if it meets a latency target. Declare failure policies, retries, backup dependencies and recovery verification before promising high availability.
23.8. Horizontal Scaling, Rebalancing, and Cluster Consistency
Adding nodes does not automatically redistribute all historical data optimally. Rebalancing may require sustained disk and network capacity plus query-routing changes. Skewed keys can leave one shard overloaded despite equal total row counts. A migration plan must preserve a deterministic mapping of data to shards and detect duplicates or gaps at cutover.
Scaling out changes the cost model rather than simply dividing latency by server count. More shards add parallel read capacity but also expand the number of remote requests, partial results, coordination operations and failure domains. Rebalancing data creates background I/O and network traffic that can interfere with foreground queries. A skewed shard key can leave one worker saturated while other machines are mostly idle. Evaluate shard-key distribution over representative event keys and time windows, then measure both per-node peak resources and end-to-end p99. The required replica count and retention factor must be included in total storage estimates.
Unit 24: External Storage and Tiered Data Architectures
ClickHouse can use local and remote storage with policy-controlled placement. Tiering changes retrieval latency, cache behavior, and operational risk, especially where many immutable parts or small objects increase metadata operations. Costs should be evaluated per workload and retention class.
24.1. Disks, Storage Policies, and Volumes
A disk configuration identifies storage endpoints; a policy describes how compatible volumes can be used. Settings apply within supported engines and server versions. Wrong volume assumptions can break retention or recovery after migration. Validate resolved configuration, disk capacity, and part placement before moving production data.
A disk is a configured storage endpoint; a volume groups storage choices under a policy that guides placement and movement. This abstraction differs from the physical allocation visible through the operating system, especially with remote object storage. Free space estimates must include temporary merge outputs and inactive parts awaiting cleanup. A named storage policy cannot create durability that the underlying device or bucket does not provide. Validate effective disk configuration and permission scopes before moving production data between tiers.
24.2. Local Disk, S3, Azure Blob, and Remote Object Storage
Local storage provides predictable access to attached hardware, while object stores expose requests, latency, and billing models that differ from block storage. Range reads, object metadata operations, and retry behavior may dominate small-query latency. Large scans can benefit from parallel object reads, subject to bandwidth and cache. Credentials and eventual consistency assumptions must be verified for the chosen service.
Object storage offers a different cost and latency profile from local SSDs. Reading a remote part can incur request latency, per-request charges, transfer costs, and cache misses; sequential bandwidth alone does not capture these penalties. Local cache capacity and eviction determine how often the same compressed blocks are fetched again. The metadata and object reference model matters for backup, part merging, and garbage collection. A successful object upload does not guarantee that an external application has captured a transactionally consistent combination of metadata and related table objects. Plan for unavailable remote endpoints and request throttling as well as for node failure.
24.3. Shared-Disk versus Shared-Nothing Storage
Shared-nothing layouts can isolate failures at the cost of data movement; shared-disk/object-store designs reduce some replication and rebalance work but centralize storage dependency. Caching and ownership metadata become critical. Neither architecture eliminates the need for access control, version coordination, and recoverable metadata.
Shared-disk and shared-nothing designs differ in how data ownership, recovery and concurrent access are organized. Shared-nothing sharding distributes durable data across worker-owned storage; shared-object-store arrangements may separate compute from persistence while maintaining node-local caches. Neither eliminates metadata coordination, consistency boundaries or the cost of moving data between workers. The benefit of independent compute scaling must be weighed against remote-read latency and cache warming. A topology diagram should distinguish authoritative object storage, ephemeral cache and replicated metadata rather than labeling every attached disk as equally durable.
Compute/storage separation is beneficial when the same durable object data can be served by multiple independently scalable compute groups, but cold-cache reads can increase request amplification and tail latency. Shared storage also creates correlated failures: an unavailable storage endpoint can affect every compute node simultaneously. Shared-nothing designs isolate certain failures but require explicit replication and data redistribution when capacity changes. Topology choices should be tested with remote-storage outage, local cache loss and shard-node replacement scenarios rather than relying solely on read throughput measured under normal conditions.
24.4. Hot, Warm, and Cold Tiers with TTL MOVE
Data access frequency and retention policy can justify tiered placement. A movement rule may reduce local footprint while increasing query costs for old partitions. Classify queries by recent and historical date ranges and measure cold-read p95/p99 separately. A tiering policy should be revised when the workload changes, not treated as an immutable property of timestamp age alone.
Hot, warm and cold tiers express expected access frequency and acceptable latency, not intrinsic properties of one ClickHouse data type. TTL MOVE can migrate older parts to a specified volume when background processing performs the transition. Late investigative queries may still need cold records and can cause network retrieval or cache warming. A policy should compare retention savings against query delays and recovery time. Data movement is not the same as deletion; access controls and backup requirements remain effective in every tier.
24.5. Caches, Metadata, and Object-Store Consistency
Metadata and data caches can reduce remote reads but must remain coherent with newly written or replaced parts. Failures during uploads or catalog updates should not expose corrupted user-visible data. Verify supported storage semantics rather than assuming all object stores behave identically. Cache hit rate is meaningful only alongside the volume and size of remote requests avoided.
Object-store latency often affects metadata and small random reads more strongly than large sequential bandwidth. A query plan selecting one sparse granule per object can generate many requests, even if total bytes are modest. Cache policies should therefore be evaluated by avoided request counts, fetched ranges, and resulting p99 latency, not only cache-hit percentage. Remote storage credentials and catalog metadata also become availability dependencies. Recovery must account for a stale or missing metadata manifest without directly changing part files.
[41]
Object-store metadata consistency and cache correctness must be considered separately. The application needs a consistent view of part manifests and their referenced objects, while a local cache serves recently read bytes that may outlive one query. Background garbage collection and object versioning affect actual retained storage. A cache miss can transform a nominally local analytical scan into many remote requests. Measure per-request latency and cache hit rates, not just aggregate object-store bandwidth.
24.6. Read/Write Throughput, Network Transfer, and Cost
Total storage cost includes stored bytes, replication, request count, transfer charges, caching capacity, and operational recovery. A high compression ratio reduces capacity but can increase CPU. For historical analytical scans, remote read bandwidth and decompression throughput jointly bound latency. Report both monetary and resource costs per comparable workload.
[41]
A storage cost model should include bytes per retained event, replica count, compression ratio, ingest rate and retention. If 100 million events per day compress to 100 bytes each, the logical compressed growth is about 10 GB/day before index metadata, views and replication. At three durable copies and 180 days, the rough retained copy footprint is 5.4 TB before backups and temporary merge space. These are estimates, not guaranteed allocation figures; engine settings and data distribution affect them. For remote object storage, include operation charges, cache misses, recovery transfers and retrieval latency. Replacing a local disk with cheaper per-GB remote storage can raise query cost if a cold workload repeatedly fetches small scattered blocks.
24.7. clickhouse-disks and Storage Inspection
Administrative disk tools and system tables can inspect configured storage paths and part placement. They should be used according to supported command semantics and with minimal privileges. Avoid making low-level file changes outside the database's coordination protocol. A repeatable storage audit verifies active parts, missing objects, cache state, and backup recoverability.
SELECT name, path, type, free_space, total_space
FROM system.disks
ORDER BY name;
clickhouse-disks and system storage tables help inspect configured volumes and the placement of data, but they do not independently validate recoverability. A file listing cannot prove that part metadata is transactionally aligned with the server's catalog or that a remote object has the required version. Use explicit backup/restore mechanisms for recoverable snapshots, and verify restored data through row counts, key samples and actual analytical queries. Capacity observations should include inactive parts and temporary merge outputs; these can consume significant space even though they are absent from active query results.
Unit 25: Clients, Drivers, APIs, and Network Protocols
Analytical service correctness is affected by client/server transport semantics. The native protocol, HTTP, SQL drivers, and compatibility interfaces differ in framing, cancellation, session state, type support, and error reporting. A query that runs correctly in a console is not automatically safe when exposed through an external API.
25.1. Native TCP, HTTP/HTTPS, and gRPC
The native protocol can support efficient structured result streaming and progress information. HTTP allows broad interoperability but needs disciplined timeouts, authentication, compression, and response streaming. gRPC-related integration depends on the supported server interface and release. Transport selection should account for cancellation, large result sets, proxies, and the difference between query completion and client reception.
The native TCP protocol, HTTP(S) interface, and optional gRPC facilities have different framing, authentication and result-streaming characteristics. Select an interface based on driver support, query execution semantics, connection reuse and transport reliability rather than syntax alone. HTTP clients should distinguish a successful transport connection from an application-level query that fails after partial output has been streamed. Idempotent retry rules differ for a read-only SELECT and a potentially committed INSERT. Use TLS with verified server identity, defined timeouts and bounded result sizes. Persisting connection credentials in URLs or query logs exposes secrets and is unsuitable for production.
25.2. ClickHouse Client, SQL Console, and Web Interface
Interactive tools allow inspecting metadata, issuing SQL, and controlling session settings. Production API behavior should not be inferred from console formatting. A query that emits millions of rows can be efficient server-side yet overload a web UI or application response buffer. Configure explicit result limits and user-specific resource controls for externally exposed endpoints.
[7]
An interactive client can hide session defaults such as database selection, time zone, input format, query limits and progress reporting. For repeatable experiments, capture server version and every nondefault setting alongside the query. Batch output may use JSONEachRow, TSV, Parquet or Arrow, each with different type and null representations. An interactive display that truncates columns or formats dates does not establish the server's underlying type semantics. Use explicit result schemas for applications and verify error handling when output is interrupted after some rows have already been returned.
A client-side timeout and a server-side cancellation are not always simultaneous. The client may abandon an HTTP connection after receiving some data while the server continues completing the expensive query until it detects cancellation. Use query identifiers and the documented cancellation path to verify termination. Validate result types outside the interactive console because display formatting may mask precision loss when a language driver converts Decimal or DateTime64 fields. Automatic pagination is a presentation feature and must not be confused with a database query that avoided scanning all matching rows.
25.3. MySQL and PostgreSQL Protocol Compatibility
Compatibility listeners facilitate selected tools and drivers but do not turn ClickHouse into a MySQL or PostgreSQL transactional server. SQL parsing, prepared statements, type encoding, metadata, and transaction commands can differ. Test the exact client library and operations in use. A successful connection handshake proves only protocol-level interoperability for that case.
Compatibility endpoints for MySQL or PostgreSQL clients can improve connectivity for existing tools but do not turn ClickHouse into a transactional replica of those databases. Supported SQL features, parameter types, result metadata, error codes and transaction behavior can differ. Run conformance tests for every application-facing query, especially around NULL values, decimals and date/time precision. An ORM expecting row-level locks or serializable transactions must not infer those facilities from a successful protocol handshake.
25.4. JDBC, ODBC, ADBC, Arrow Flight, and Native Interfaces
Driver selection affects supported formats, metadata mapping, batching, cancellation, and throughput. Columnar formats such as Arrow can avoid unnecessary row-by-row materialization in some analytical workflows. Connection reuse and fetch size require tuning against memory and p99 latency. An ORM designed for transactional updates may produce inappropriate SQL or concurrency patterns for ClickHouse.
JDBC and ODBC provide standardized interfaces but may hide native ClickHouse capabilities or map types imprecisely. ADBC and Arrow-oriented paths can reduce conversion overhead for columnar transfers when supported by the driver stack. Connector performance depends on parameter binding, fetch size, network framing, backpressure and materialization in the consuming language runtime. An Arrow Flight integration advertised by a particular component should not be assumed available as an identical server endpoint in every ClickHouse release. Test driver behavior for DateTime64 precision, Nullable fields, arrays, large integers, decimal scale and cancellation.
25.5. Framing Formats and Large Data Transfers
Record boundaries matter for row-oriented streams, while block boundaries and schema descriptors matter for columnar frames. A client must avoid treating arbitrary network reads as complete logical records. For large exports, stream results and enforce backpressure rather than materializing all rows in application heap. Compression trades CPU against network bytes; benchmark with representative payloads.
Large result sets should be streamed in bounded chunks rather than accumulated in application memory. Framing formats influence error detection: a line-oriented format can be consumed incrementally, but a partial network response may end without the producer completing the intended query. Compression can reduce transfer bytes while moving CPU cost to client decoding. Query IDs, server-side timeout settings and transport cancellation behavior must be coordinated so abandoned requests do not continue consuming expensive resources indefinitely. Measure peak client allocations and network throughput, not only the database execution time shown by the server.
25.6. Schema Inference and API Response Formats
An API should provide stable field names, units, types, and null conventions instead of leaking arbitrary engine-specific formatting. Schema inference from a partial response may omit rare values or later-introduced fields. Version analytical API contracts and distinguish approximate metrics from exact counts. Endpoints should document freshness and source-watermark limitations where they affect interpretation.
[46]
Schema inference from JSON, CSV or Parquet samples can fail when early records lack optional fields or use narrower numeric values than later records. A text-based transport may render null and empty string differently from a typed columnar transport. For an API returning billions of events, an implicit schema inferred on each request can introduce type instability between consumers. Define column names, precision, nullability and time zone expectations in the interface contract. Compare decoded client rows with a small reference query before evaluating throughput. A schema mismatch is a correctness failure even if the transport successfully delivered every byte.
25.7. TLS, SSH, Endpoint Architecture, and Connection Pooling
TLS protects transport confidentiality and integrity when endpoints and certificates are verified correctly. SSH tunneling may be a restricted administrative path, not a substitute for server-side authorization. Connection pools limit connection setup cost but can over-amplify concurrent heavy queries if sized for OLTP assumptions. Align timeout, cancellation, and workload quotas across clients and server.
Long-running analytical requests should propagate cancellation through client, proxy, and ClickHouse server. A reverse proxy timeout that disconnects a browser does not necessarily stop the server query. Unbounded connection pools can compound this issue by admitting more expensive work than the cluster can sustain. Set explicit concurrency ceilings, query execution limits, and bounded result streaming at all layers. TLS identities must be validated end to end when clients and proxies terminate separate encrypted sessions.
Connection pooling reduces repeated handshake cost but must observe server-side concurrency limits, cancellation semantics and credential rotation. TLS protects transport only when certificate identity is verified; accepting any certificate defeats important authentication guarantees. SSH tunneling can restrict network exposure but adds another operational credential and failure dependency. Set explicit connection and read timeouts and distinguish an interrupted SELECT from an INSERT whose final state is uncertain. Driver retry behavior is part of the application's data-consistency model.
25.8. Prometheus, MCP, and Other Integration Protocols
Monitoring export interfaces and model/tool integration protocols have different trust and data-exposure boundaries. Metrics endpoints may reveal sensitive topology or query workload information. A tool gateway that can issue SQL must enforce minimal permissions and query limits independently of the caller's natural-language request. Protocol support must be verified for the specific release and deployment model.
Prometheus-compatible metrics expose operational measurements, but their existence does not justify unlimited cardinality in exported label sets. Tracking query IDs, arbitrary SQL or event identifiers as metric labels can overload a monitoring service and leak sensitive data. Integration protocols such as MCP serve specific tooling and orchestration functions; they should not be interpreted as additional database transaction guarantees. A monitoring endpoint must be secured and capacity-limited independently of the query interface. Separate machine metrics, asynchronous background work and user-visible SQL metrics when investigating the origin of tail latency.
Unit 26: Change Data Capture (CDC) with Oracle, Debezium, Kafka, and ClickHouse
The CDC problem is not merely transport. Ordering, offsets, at-least-once delivery, duplicates and the mapping from source transactions to the analytical model must remain explicit.
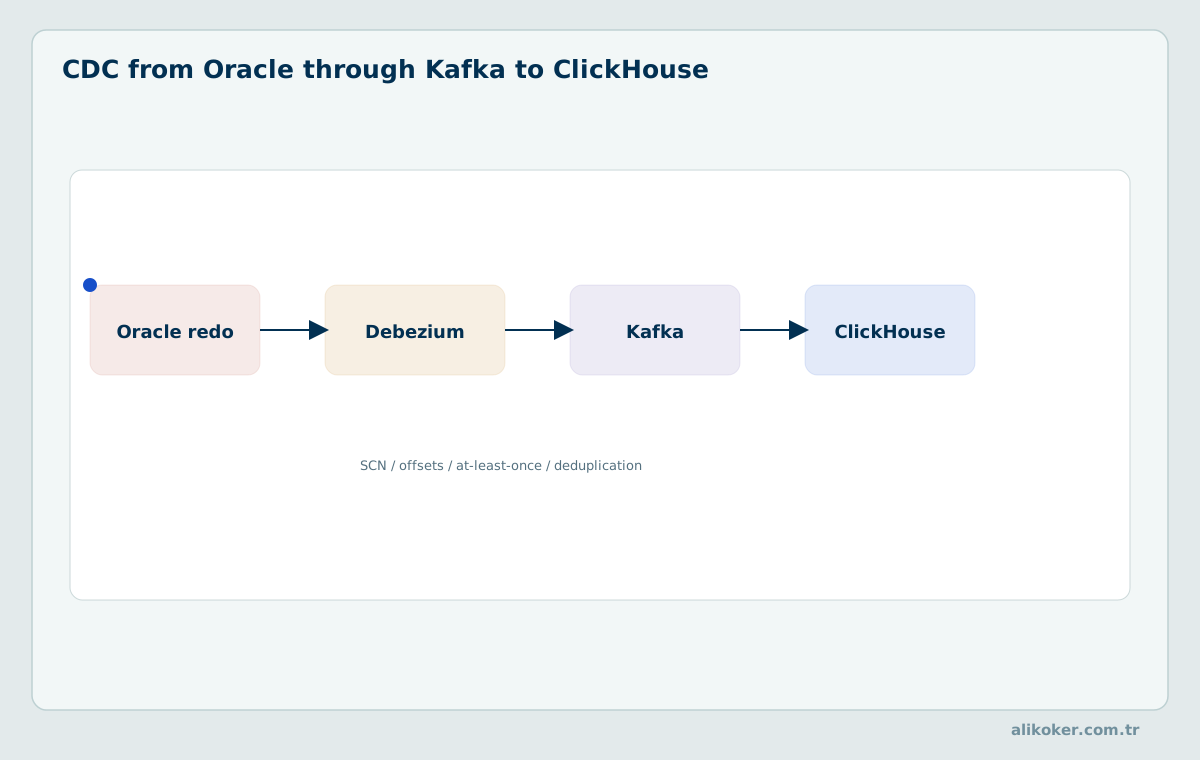
Replicating Oracle transactions into ClickHouse requires a correctness contract across the source log, connector, broker, transformation, and analytical table. The challenge is not simply moving bytes quickly; it is preserving source transaction meaning while adapting mutable records to an append-oriented analytics model.
26.1. Oracle Redo Logs, SCN, and LogMiner
Oracle redo records enable recovery and log-based change capture. System Change Numbers (SCNs) provide a basis for ordering and consistent extraction boundaries under documented Oracle semantics. LogMiner can expose changes subject to permissions, configuration, log availability, and source workload cost. Source commit ordering must be distinguished from the time a connector publishes a message.
Oracle redo records describe changes in a transaction log, while the system change number (SCN) provides an ordering reference used by appropriate snapshot and log-mining mechanisms. LogMiner-based capture has operational and supplemental-logging requirements that vary with database and connector versions. SCN and wall-clock event time serve different purposes; they should not be used interchangeably to resolve late updates. A reliable CDC start records the source snapshot position and the first log interval from which subsequent commits will be captured.
26.2. GoldenGate, Debezium, XStream, and OpenLogReplicator
Oracle GoldenGate and Debezium offer different deployment, licensing, support, and integration profiles. Debezium's Oracle connector may use LogMiner, XStream, or supported alternatives such as OpenLogReplicator, each with separate operational requirements. XStream-based extraction can retain Oracle licensing obligations. Compare actual compatibility, redo-log retention, data-type handling, and recovery behavior rather than assuming all connectors are interchangeable.
GoldenGate is a commercial replication technology; Debezium is an open-source CDC framework with Oracle adapters using different underlying change-capture mechanisms. Oracle XStream usage can involve GoldenGate licensing requirements, so replacing an application component does not universally eliminate licensing costs. Connector options also vary in throughput, operational complexity and source prerequisites. OpenLogReplicator is another potential log-reading element with its own compatibility constraints. Compare these systems on source impact, ordering guarantees, recovery position tracking and measurable end-to-end correctness, not on the label “free” alone.
26.3. Oracle Supplemental Logging and Initial Snapshots
CDC needs enough logged information to identify modified rows; supplemental logging settings affect this availability and source overhead. A consistent snapshot must establish a source boundary from which streaming changes can be applied without omissions or double counting. Large initial reads can pressure Oracle/Exadata storage, so schedule and throttle according to OLTP latency objectives.
Oracle log-based capture needs a stable initial snapshot boundary and sufficient log information to reconstruct before and after values for the chosen CDC adapter. Supplemental logging requirements depend on connector configuration and how changed rows are identified. A snapshot taken without recording a consistent SCN boundary may overlap or leave a gap when streaming begins. Extracting very large tables also consumes source I/O and undo or redo-related resources, so snapshot throttling is part of source-system protection. The destination must know whether snapshot rows precede or follow the same entity's later captured changes. Compare logical keys and commit positions, not only timestamps in wall-clock order.
The required redo retention window must cover the full initial snapshot duration and any expected connector outage, or the streaming phase may lack the log interval needed to bridge the handover. Supplemental logging can increase source redo volume, which should be measured under representative update traffic. Source permissions and supported database versions constrain which mining method can be used. A record-count match after the snapshot does not prove that updates committed during extraction were applied exactly once; validate sample keys across the boundary SCN and replay them after a simulated failure.
26.4. Kafka Connect, Topic Schemas, and Offset Management
Connector offsets identify progress through captured changes; Kafka partition offsets order messages only within the relevant partition. Schema registries or explicit serialization contracts manage changing record formats. Restart correctness requires coordination among connector checkpoints, broker delivery, and target writes. A successful Kafka publish is not proof of durable analytical application.
Kafka Connect manages connector tasks and offsets, while Kafka topics partition the event sequence for scalable delivery. Offset commits are not by themselves proof that a downstream ClickHouse materialized view is fully durable. A schema registry or versioned event envelope helps consumers interpret field changes without guessing from payload samples. Partition keys should preserve ordering for logical entities that depend on sequential updates. During recovery, reconcile connector offsets, Kafka retention and ClickHouse applied positions before truncating or replaying a topic.
26.5. Kafka Ingestion, Offsets, Batches, and Recovery
Kafka partitions provide ordered offsets within each partition, not a global ordering across all partitions. Committing a consumer offset before durable target handling risks loss; committing after target acceptance can cause duplicates on replay. The appropriate design uses idempotency and checkpoint coordination. Distinguish ingest acknowledgment from all materialized downstream outputs being correct.
Kafka partitions guarantee an order within each partition, not one global order across the entire topic. A logical entity sent to multiple partitions can experience reordering unless the producer's keying strategy preserves the relevant sequence. Consumer offsets describe what has been read or committed by the consumer group, not automatically what every downstream analytical table has durably applied. A restart can replay events from an earlier offset; correct downstream behavior therefore needs stable event IDs, deterministic version selection or explicit replay-safe state changes. Invalid messages should be routed to a documented error workflow with traceable source offsets rather than silently discarded. Throughput tests must include broker fetch rate, parsing CPU, ClickHouse batching, background merging, and materialized-view cost.
A practical broker recovery test uses an event key whose updates are intentionally sent before and after partition reassignment. The final ClickHouse current-state query should select the version implied by source commit ordering even when deliveries repeat or arrive with unequal delays. Track topic offsets and the durable analytical watermark separately. Kafka Connect may recover a task from its committed position, but a prior target insert that completed just before that offset was saved is precisely the case in which deduplication is needed. This test is stronger than checking that the consumer lag eventually reaches zero.
26.6. Preserving Order Across Snapshots and Streams
A snapshot and live stream must overlap or meet at a defined consistent boundary so that no committed source event is omitted. Deduplicate overlapping events using stable source identity and sequence. Parallel partitions can reorder independent keys, and downstream processing can observe events later than their event timestamps. Validation should compare reconstructed state at known SCNs or equivalent source watermarks.
Construct a recovery test with an Oracle snapshot at committed sequence boundary W, messages with sequences W−1, W, and W+1, and a forced restart between Kafka acknowledgment and ClickHouse write completion. The restored pipeline must demonstrate that all transactions through W are represented once in current-state interpretation and that W+1 is neither lost nor permanently duplicated. Per-partition Kafka offset progress cannot be substituted for an Oracle-global source boundary without a justified mapping.
Oracle redo + SCN
       ↓
Debezium LogMiner / XStream / OpenLogReplicator
       ↓
Kafka topic + offset + schema history
       ↓
ClickHouse raw change log
       ↓
Current-state model / time series / aggregation
An initial Oracle snapshot and its ongoing redo stream must describe one coherent source history. The snapshot establishes a consistent database position such as a source SCN, and change records after that boundary are applied according to their commit ordering. Source transactions can span multiple tables; a ClickHouse pipeline that loads each table independently may expose only a prefix of such a transaction. If the application requires cross-table consistency, publish a shared applied watermark or gate reports until every required stream reaches the specified source boundary. Kafka's partitions introduce an additional layer of ordering, and offsets within different partitions do not form one global sequence. A crash after target insertion but before offset acknowledgement causes replay, making stable event keys and deterministic upsert/delete modeling essential. Event timestamps are not interchangeable with source commit order: late events and retroactive corrections must be handled separately.
Consider a source transaction T that changes a customer classification and inserts an event referring to that customer. A CDC pipeline may publish those changes to separate Kafka topics. If the fact topic reaches ClickHouse first, the event may be joined against the previous dimension version. If the dimension update arrives later, simply changing the dictionary does not automatically recompute a previously materialized aggregate. Consistent reporting requires either temporal dimension lookup by source commit position, reprocessing of affected facts, or withholding publication until the needed streams reach the source watermark.
A scalar watermark is insufficient if events for one logical transaction are distributed across independent partitions with different progress positions. A vector of applied offsets or a transaction-level completion ledger can establish which updates are jointly visible. This is separate from producer idempotence: a crash can replay the same record after ClickHouse accepts it, even when the broker delivered it according to its configured acknowledgment contract. Keep durable event identities and apply the same ordering to inserts, changes and tombstones. Reconciliation should deliberately inspect source operations on snapshot boundaries and after broker partition reassignment.
26.7. Translating UPDATE/DELETE Events into ClickHouse Models
A mutable source row may be represented in ClickHouse by a newer version, a deletion marker, or a supported mutation strategy. ReplacingMergeTree requires an explicit key/version model; direct mutations have different cost and visibility. Historical event analytics may intentionally retain all changes, while current-state analytics must resolve superseded versions and tombstones. Mixing these use cases in one table without a clear query contract leads to incorrect counts.
An Oracle UPDATE event may be represented as a versioned append in ClickHouse, a mutation, or a derived current-state table. Each strategy has different read costs and correctness conditions. DELETE events often need a tombstone or equivalent logical state so that replay of an older insert cannot resurrect a record. Preserve source identity and commit order rather than relying solely on arrival timestamp. If an update changes the event's grouping dimensions, an incremental preaggregation may require compensating the old group as well as adding the new one.
26.8. At-Least-Once Delivery, Deduplication, and Data Validation
At-least-once transport permits repeated messages after failure. Target deduplication must distinguish retransmissions from actual updates with the same business key. Counts and aggregate hashes can supplement keyed comparisons but do not certify complete parity when source and target have different null or timestamp representations. Design reconciliation around transaction cutoffs and business invariants.
A reconciliation test can compare counts by source transaction sequence, but count equality is only a necessary condition for many workloads. Two missing source rows and two duplicated rows can preserve the same total count. Therefore compare stable business identities and versions over sampled or exhaustive windows, include source deletion markers, and validate aggregates such as sums by tenant/date. When exact source event lineage is available, compute an order-insensitive digest over canonical typed values as an additional check, taking care not to mistake a digest for proof of semantic correctness.
At-least-once delivery is compatible with exact analytical results only when repeated delivery is identified or neutralized downstream. Deduplicating by payload bytes is insufficient when a legitimate event can occur twice or when an identical logical event is serialized differently. A stable source record identifier combined with operation sequence or source commit position provides a more defensible key. For updates, the target must select the intended latest version; for deletes, tombstones must prevent resurrecting an old version during replay. Compare reconciliation counts by table and time window, verify representative logical keys, and validate aggregates that are sensitive to duplicate input. Source data and replay logs must be retained long enough to reconstruct a failed interval.
26.9. Backfills, Schema Evolution, and Recovery from Failure
Backfilling old ranges while live data continues requires watermarks that partition the source timeline. A schema change may alter type widths, null semantics, and serialization of new events; replaying older events then requires compatible decoding. Test restart from stored offsets, expired redo logs, source failover, and partially written analytical batches in controlled conditions.
A backfill should declare an immutable source boundary, an extraction predicate, expected key cardinalities and the relationship to the live stream. If the historical range is loaded while live CDC continues, overlap handling is mandatory; otherwise the same source operation can contribute twice to a ClickHouse aggregate. Schema changes during a long-running import require either versioned decoders or an explicit pause and controlled migration. A stopped importer must resume from persisted offsets and documented checkpoints, not solely from its last wall-clock timestamp. Recovery tests should reproduce an interruption between writing target rows and advancing the source offset and then prove that replay preserves logical results. Historical deletes and updates must be re-applied using the same ordering rules as the live stream.
Historical loads and continuous CDC should form one replayable sequence. A snapshot range can be defined by a source SCN or another consistent commit boundary; rows extracted after that point but interpreted as pre-snapshot values can create version conflicts. Keep raw event or commit metadata until source-to-target reconciliation confirms the migrated interval. A changed schema should be applied using versioned transformations, not by letting a generic JSON parser silently infer different meanings from separate input batches.
After an importer crash, determine which target rows were stored and which source offsets were durably committed. Do not restart from a wall-clock event_time alone: old events can arrive late and updates can be effective retroactively. Overlapping backfill can be deduplicated using stable keys and source ordering, while a replacement-style target must use a monotonic version rule. Verify several windows separately, including intervals containing DELETE events, null fields and duplicate business identifiers. A checksum of the number of imported bytes cannot establish logical equivalence when row mappings change.
26.10. Source Transactions and Analytical Workload Isolation
The OLTP database remains the owner of transactional writes and constraints. ClickHouse serves analytical reads without imposing OLTP-like update patterns on its entire storage model. Measure the net Oracle resource reduction together with log extraction cost, initial snapshot cost, target infrastructure, and operational recovery requirements. A faster analytical query alone does not establish a safer system architecture.
Isolation of analytical reads can protect an Oracle OLTP instance from expensive reporting scans, but initial extraction, redo mining and CDC still consume production resources. Measure additional redo generation, log retention, extraction I/O and peak transaction latency at the source. A design that reduces average SELECT time on ClickHouse is not successful if it increases p99 write latency on the source beyond its service-level budget. Compare Exadata or other transactional infrastructure cost under matched workloads and verify that moved reports no longer place equivalent read pressure on Oracle. Avoid assuming that every analytic table requires exact row-for-row duplication of every source field.
Unit 27: Server Configuration and Resource Management
Server configuration is part of the executable system specification: settings affect memory limits, scheduling, query semantics, credentials, and fault recovery. Effective values may combine configuration files, user profiles, session settings, and query overrides. Record precedence and observed values rather than assuming a checked-in file is authoritative.
27.1. XML/YAML Merging, Environment Variables, and Secrets
Configuration fragments may merge into one effective server configuration according to supported rules. Environment variables and secret references avoid embedding fixed credentials in source control, but require secure distribution and access controls. Unintended override order can weaken network restrictions or modify memory behavior. Validate resolved settings on a test instance before promotion.
Configuration precedence must be established from the actual deployment rather than guessed from one file. XML or YAML fragments can be merged through server-specific rules; environment-variable substitution and secret references require careful quoting and file permissions. A startup override may replace or append a setting in a different order than expected. Record the effective configuration exposed by supported introspection facilities and compare it against source-controlled intended settings after every rollout. Do not embed passwords or private keys in diagnostic attachments. Some configuration values require a restart and others support dynamic updates; verify their scope and timing on the selected release.
27.2. Setting Scopes, Precedence, Profiles, and Constraints
Settings may apply at server, user/profile, session, or query scope; not all settings support all scopes. Profiles can constrain acceptable ranges. For reproducible experiments, persist effective setting values alongside query text, version, and hardware. Query-level overrides should be controlled to prevent bypassing workload isolation or memory constraints.
SELECT name, value, changed
FROM system.settings
WHERE name IN ('max_threads', 'max_memory_usage', 'max_execution_time');
System defaults, per-user profiles, role settings and per-query overrides can interact. A setting name in one profile does not prove that a query used that value when a more specific scope takes precedence. Capture effective settings in an experiment and test whether a service account is permitted to override safety limits. Roles should express privilege while profiles govern workload limits and behavior; conflating the two makes production policy difficult to audit. A benchmark that silently disables memory or execution guardrails cannot be compared fairly against a guarded production deployment.
27.3. Quotas, Read-Only Modes, allow_ddl, and Complexity Limits
Quotas regulate resource consumption over defined windows, while read-only and DDL restrictions constrain operations. A read-only query can still exhaust CPU, memory, or result bandwidth. Limit concurrent requests, elapsed time, scanned rows/bytes, and output size according to tenant and workload. Security policy should not rely on a single setting name without verifying its exact effect.
Quotas and complexity limits constrain a query before it becomes an uncontrolled load. Read-only modes and DDL permission settings have different semantics, so one does not automatically substitute for the other. Restricting result rows is not the same as limiting rows scanned or bytes read. A user may return ten rows from a very expensive aggregation. Test guardrails against wide scans, high-cardinality GROUP BY, large joins and long-running streaming results, including how the server reports cancellation and partial output.
27.4. Memory Overcommit and Query Memory Thresholds
Memory trackers estimate allocations for queries and server components. Per-query and user-wide ceilings protect shared capacity but may reject legitimate large aggregations. Overcommit mechanisms can select operations for termination under pressure. Consider background merges, decompression, and cache use when sizing headroom; peak-process memory can differ from tracked query allocations.
Per-query memory limits and process-wide memory exhaustion are related but not identical. Concurrent hash aggregations, join builds and parallel scan buffers can multiply peak allocations even when each query is below its configured cap. The Linux out-of-memory killer may intervene before application-level spill or memory-overcommit controls can recover. Reserve space for background merges, replication, HTTP serving, page caches and the operating system. Test concurrency at realistic arrival rates and record both instantaneous peaks and sustained memory pressure; a single successful large query does not prove that the node can sustain several such queries at once.
27.5. Workload Scheduling, CPU/I/O, and Resource Hierarchies
Workload scheduling can allocate limited CPU and I/O fairly, by priority, or through policies favoring short-running work where supported. Such policies change queue time and resource distribution but do not reduce the intrinsic work of a query. Evaluate latency distributions for each class under mixed load. Priorities must not allow a sustained low-priority starvation regime unless explicitly accepted.
A simple fairness experiment uses two query classes: short selective dashboard requests and large scans. Under uncontrolled concurrency, scans may monopolize processing lanes and raise dashboard p99. A fair or short-query-aware scheduler may reduce this tail latency without changing either query's logical work. However, the scan class may then experience longer queue time. Record per-class throughput, queue duration, CPU seconds, and completion fairness, and do not describe the change as a universal reduction in CPU cost.
[41]
Resource scheduling allocates contention among query classes, potentially prioritizing short interactive requests over long analytical batches. Scheduler fairness, priorities and concurrency caps can be implemented differently between releases; verify feature availability and effective settings before adopting a named policy. Increasing available worker threads can raise throughput until shared memory bandwidth or I/O saturates, after which tail latency may worsen. Measure p95/p99 separately for short and long query populations under mixed load. Scheduling cannot eliminate the work itself; it changes admission order, resource shares and waiting time.
27.6. Server Overload, Connection Limits, and Rate Control
A server may become overloaded through memory allocation, thread pressure, storage queues, or too many admitted queries. Limiting connections alone does not bound work because a few expensive queries can dominate resources. Admission control should consider expected cost, active memory, execution slots, and timeout. Test behavior at the saturation boundary and during recovery from bursts.
Admission control should prevent a sudden arrival burst from exhausting available execution slots and memory. Rate limiting client connections is not equivalent to scheduling active queries, and both have separate error and retry effects. A retry storm following timeouts can amplify overload unless callers apply bounded backoff and idempotent request behavior. Compare offered load to completed throughput and measure queue waiting time. Sustained throughput is meaningful only if the system remains stable without an ever-growing waiting backlog.
27.7. Named Collections, Startup Scripts, and System Inspection
Named collections centralize configuration for external services and connectors, reducing duplicated credentials and inconsistent endpoints. Startup automation should be deterministic, idempotent where applicable, and version aware. Inspect effective configuration and availability through documented system facilities. Never place secrets or full privileged configuration dumps into public diagnostics.
Named collections centralize supported external connection parameters, helping avoid repeated credentials in SQL statements. Their existence does not remove the need to protect configuration files, environment variables and diagnostic exports. Startup scripts can establish resources or settings but may run under elevated permissions and should be audited accordingly. Compare the effective system configuration against the intended deployment manifest after restart; relying on the presence of one file can miss precedence and merge behavior.
27.8. Multitenancy and Resource Isolation
Tenant separation involves permissions, query quotas, scheduling, data placement, and network boundaries. Logical separation without resource constraints permits noisy-neighbor interference. A very expensive query can affect other users even when row-level access is correct. Measure fairness and tail latency under simultaneous tenants, including cold cache and ingestion workloads.
Multi-tenancy requires limits on both resource utilization and information access. A logical database name is not an adequate isolation boundary when every tenant can still issue arbitrary joins against shared tables or exhaust server memory. Use role-based privileges, query quotas, memory limits and, where necessary, separate compute pools or clusters for materially different service objectives. A malicious or accidental high-cardinality query can create an asymmetric resource demand; protective settings should be tested against adversarial input sizes. Operational logs and query histories may contain tenant identifiers or secrets and need their own access restrictions.
Unit 28: Security, Authorization, and Authentication
ClickHouse security requires defense in depth: network restriction, cryptographic transport, authentication, least-privilege roles, secret management, and auditing. Analytical data often aggregates sensitive information, so read-only access can still expose valuable or regulated records.
28.1. RBAC Users, Roles, Grants, and Access Entities
Users receive privileges directly or through roles. Separate administrators, ingestion identities, diagnostic accounts, and read-only analysts. Avoid broad wildcard grants for application credentials. A query with SELECT privilege may still read sensitive columns or derive individual attributes from small groups; data governance must address schema and output limits as well as engine permissions.
CREATE ROLE analytics_reader;
GRANT SELECT ON default.events TO analytics_reader;
A least-privilege deployment distinguishes administrative DDL, data insertion, analytical reads, dictionary access and configuration management. Role grants should be evaluated using the actual service identity rather than a powerful interactive administrator account. An application that only executes SELECT should not need mutation or cluster-management privileges. Privilege inheritance and default roles can make an apparent narrow grant wider in effect; inspect the resulting permission set and test an intentionally forbidden operation. Separate authentication success from the authorization of one SQL operation, and audit changes to roles and sensitive access entities.
28.2. Network Ports, Bind Addresses, and Segmentation
Expose only required protocol listeners to permitted network segments. Native, HTTP, and management interfaces may have different port and TLS requirements. An internal endpoint is not inherently trusted; use identity and network policy together. Review IPv4 and IPv6 listener configuration and avoid accidental public binding in containerized deployments.
Bind database services only on interfaces required by clients and administrators. Publicly exposed native SQL or HTTP endpoints increase attack surface even when authentication is enabled. Use network segmentation, firewall rules and separate management paths appropriate to the deployment. Container port mappings and load balancers can accidentally expose endpoints that are intended to remain private. Verify exposure from outside the host as well as through local configuration inspection.
28.3. TLS, mTLS, Certificates, and ACME Life Cycles
TLS server identity validation prevents passive interception and many active attacks. Mutual TLS can authenticate clients through issued certificates where supported. Rotating certificates must account for trust anchors, expiry, and service restart or reload behavior. ACME automation should not compromise key custody. Test hostname validation and failure on invalid certificates, not just successful encrypted connections.
TLS server authentication requires a trusted certificate chain and hostname validation. Mutual TLS additionally authenticates the client certificate under configured trust and mapping rules. Certificate rotation must account for clients holding persistent pooled connections. ACME can automate certain public certificate issuance workflows, but not every internal network or private service identity is suitable for public validation. Test expired certificates, revoked credentials and incorrect names to ensure the client rejects insecure connections.
28.4. LDAP, Kerberos, JWT, and HTTP Authentication
Authentication methods have different dependencies and security properties. LDAP and Kerberos rely on infrastructure that may be unavailable in isolated installations. JWT validation needs strict issuer, audience, signature, expiry, and key-rotation handling. HTTP authentication should be protected by TLS and bounded by rate/resource controls. Deployment-specific support must be confirmed rather than inferred from generic product descriptions.
When using JWT for a deployed interface, validate at least signature algorithm and key, issuer, audience, issuance and expiry times, and revoked/rotated signing keys according to the supported integration. A token sent to an unsupported ClickHouse OSS listener is not made valid merely because a managed Cloud service supports related functionality. LDAP integration should be treated similarly: dependence on a corporate directory changes system availability and incident response. Keep authorization grants inside the server independently of authentication provenance.
[41]
LDAP and Kerberos address identity integration through different protocols; JWT validates signed claims under specified key, audience and expiration rules. An HTTP authentication gateway is not automatically equivalent to native database authorization. Feature exposure can differ between managed and open-source editions or between releases. Time-limited credentials reduce exposure only when revocation, key rotation and clock-skew handling are defined. Logging must not record passwords, tokens, private keys or complete authenticated request headers. An authentication benchmark cannot replace testing whether a user can read another tenant's rows through an authorized yet overly broad SQL view.
28.5. External Authenticators, SSH Keys, and X.509
External identity systems introduce availability and revocation dependencies. SSH public-key mechanisms and X.509 certificate authorization apply only through supported server workflows. Credential material should not be repurposed across unrelated protocols. Recovery accounts and break-glass procedures require limited, auditable access paths and regular testing.
External identity providers require explicit failure behavior. During an LDAP or token verification outage, fail-open access may violate security requirements, while fail-closed access can reduce availability; the policy must be intentional. An SSH public key proves possession of a private key for a specific protocol context but does not automatically establish the same identity guarantees for an unrelated database endpoint. X.509 certificates bind an identity to a key subject to trust-chain validation, name checking and lifecycle management. Secrets passed through environment variables or named collections require separate controls for process inspection, backup export and diagnostic output.
28.6. TOTP and Service-Account Models
Time-based one-time passwords can supplement applicable interactive workflows but are not a replacement for certificate or key management in automation. Service accounts should have narrow grants, deterministic ownership, and planned rotation. Noninteractive credentials must be excluded from source control and diagnostic output. Record which authentication mechanisms are actually supported in OSS versus managed environments.
Time-based one-time passwords are an additional authentication factor when supported by the selected configuration, not a replacement for narrowly scoped database roles. Automated service accounts usually need noninteractive credential mechanisms with rotation and auditable privilege boundaries. Shared administrative passwords undermine attribution and increase blast radius. Evaluate the consequences of clock skew and unavailable identity providers before requiring interactive factors on automated recovery paths.
28.7. Secret Management and Password Risks
Credentials can leak through configuration, query text, process arguments, logs, traces, backups, and support bundles. Prefer controlled secret injection and minimize lifetime and privilege. Redaction must cover both successful and failing requests. Password rotation should not leave stale replicas or clients with elevated fallback credentials.
Passwords, tokens and signing keys should not be embedded in SQL course examples, startup scripts or URLs that may be logged. Store secrets through supported protected configuration and retrieval facilities, and limit the identities authorized to read them. Rotation procedures must consider active connections, rollback, backup archives and disaster-recovery environments. Redaction in application logs does not guarantee secrets are absent from database query logs or diagnostic dumps. Audit both paths.
28.8. Least Privilege, Audit, and Compliance
Auditing records who performed sensitive operations and when, subject to privacy and retention policies. Logs should avoid unnecessary exposure of full SQL literals and personal identifiers. A compliance claim must be tied to a defined regulatory requirement, tested deletion/backup behavior, and operational controls. Encryption at rest alone does not establish complete data governance.
Analytical least privilege is more demanding than denying writes. A principal granted SELECT on a broad events table may reconstruct individual behavior through highly selective predicates. Separate public aggregates from raw records and apply tenant-level access restrictions at the data model or query enforcement boundary. Enforce bounded query resource use as well as authorization. Any compliance assertion must identify actual retention, deletion, audit, and backup policies, since engine access control by itself does not establish regulatory compliance.
CREATE TOKEN
VALID FOR INTERVAL 30 MINUTE
GRANTS (SELECT ON analytics.events);
[46]
Security review should connect roles, network exposure, credential expiry, auditing and backup confidentiality. The expected effect of a permission change must be checked on a real restricted account, not assumed from a configuration diff. Query history may reveal personally identifying data even when SELECT output is access-controlled. Replicas and backups extend the perimeter where data must remain encrypted and access-managed. A published performance test that disables authentication may be useful as a microbenchmark but does not establish the security cost of a production architecture.
Unit 29: Backup, Restore, and Disaster Recovery
Replication and backup solve different problems. Backups preserve recoverable historical state; replicas support availability but commonly propagate logical deletions and bad writes. Recovery engineering must define consistency boundaries and demonstrate that a restored system can answer the intended queries.
29.1. BACKUP/RESTORE Scope and Consistency
A backup must identify included databases, tables, metadata, and access entities, as well as the point-in-time visibility boundary. Concurrent inserts and mutations complicate consistency if snapshot semantics are misunderstood. Restore correctness requires confirming schema, row counts, representative business aggregates, and background processing state after data becomes available.
BACKUP TABLE default.events
TO Disk('backups', 'events_20261027');
BACKUP and RESTORE operate within supported table, database and storage scopes. A consistent backup must include the data and metadata necessary to interpret it at a declared boundary. Live inserts and distributed replicas complicate that boundary; taking an uncoordinated copy of files is not equivalent to a tested logical snapshot. Preserve manifests, access entities when needed, encryption keys and required external object references. Verification consists of restoring to an independent destination and comparing representative query results.
29.2. Full, Incremental, Synchronous, and Asynchronous Backups
Full backups contain a baseline; incremental backups depend on referenced prior state or data. Losing a required earlier component can invalidate a later restore chain. Asynchronous execution returns progress rather than immediate completion. Check job status, object availability, and integrity before considering a backup successful.
A full backup captures an independently restorable baseline; an incremental backup depends on earlier state and any chain-specific metadata required for reconstruction. Losing one link in a dependency chain can make later backups unusable. Asynchronous completion means a submitted backup request is not necessarily a verified durable copy. Backup windows must include the time to transfer data, validate integrity and store metadata. Snapshot-based techniques can be efficient when the storage layer supplies atomic snapshots, but copying directories without a consistency boundary does not create an equivalent logical backup. Schedule an actual restore to a separate environment and run representative queries over recovered rows.
29.3. Local Disk, S3, and Azure Blob Backup Targets
Backup target choice affects throughput, durability, failure domains, and monetary cost. Remote object stores require correct credentials, object lifecycle policies, and verification of completed writes. Local backups on the same failure domain as production disks do not protect against that domain's destruction. Encrypt and restrict backup access because backups preserve sensitive data even after a live-table deletion.
Local disk, S3 and Azure Blob backups have different capacity, latency, authentication and failure properties. A local backup on the same disk as production data does not protect against that disk's failure. A remote backup can survive local loss but may be inaccessible during network or credential outages. Estimate restoration bandwidth and object request costs, not only stored bytes. Apply retention and access controls independently from the running database's replica policy.
29.4. Filesystem Snapshots and Metadata-Only Recovery
Snapshots can create a storage-consistent view quickly under supported filesystem and engine conditions. They are not automatically a portable logical backup if metadata and external parts are inconsistent. Recovery from metadata alone is possible only when the underlying data and coordination state meet the required constraints. Document exactly which storage objects, catalog entries, and version assumptions the procedure needs.
Filesystem snapshots provide a point-in-time block-level view only according to the filesystem or storage service's guarantees. In a replicated or remote-storage topology, local filesystem state may not include all necessary objects and coordination metadata. A metadata-only backup cannot recreate arbitrary missing data bytes merely because table definitions survive. Recovery planning must list table definitions, access entities, underlying part objects, source replay logs and dependencies. Validate that the restored system can answer a query at the intended source watermark before claiming RPO or RTO compliance.
29.5. Backup Compression, Access Entities, and Settings
Compression saves backup bytes at the cost of CPU and, sometimes, higher recovery latency. Access entities and server settings may be required for application behavior even when tables restore successfully. Restore procedures must handle secret references without copying credentials into inappropriate environments. Validate encryption and integrity at rest and in transfer.
Backup compression saves capacity at the expense of encoding and decoding CPU. Encrypting and protecting backup objects is essential because recovered data can contain the same sensitive fields as the live system. Access entities, users and role grants may need explicit inclusion and separate restore tests depending on the backup mechanism. A tiny backup file that omits external dependencies is not a complete recovery image. Inspect manifests and test at least one restore after changing backup configuration.
29.6. Why Replication Is Not a Backup
Replica synchronization can reproduce corrupted or accidentally deleted logical data. Backups provide recoverable points outside normal replication propagation. Effective protection combines independent backup locations, tested retention, and authorization boundaries for deletion. An unchanged replica count does not guarantee protection against common-mode errors.
Replication addresses certain node failures by maintaining additional online copies; backup addresses historical recovery from mistakes, corruption or events propagated to every replica. If an administrator drops a replicated table or an erroneous mutation spreads across replicas, all online copies may contain the same damage. An independently retained backup with controlled write access protects a different failure mode. Recovery tests should include simulated accidental deletion, metadata damage, a missing backup chain element and unavailable remote storage. Keep the restore process reproducible and measure elapsed recovery time rather than using the size of stored backups as proof of recoverability.
29.7. RPO, RTO, Cross-Region Recovery, and Restore Tests
Recovery point objective (RPO) bounds acceptable lost history; recovery time objective (RTO) bounds restoration duration. For D bytes and sustained restore bandwidth β, raw transfer time is at least D/β before verification, metadata, decompression, and reindexing costs. Cross-region recovery also depends on network bandwidth and control-plane availability. Test the complete runbook against realistic dataset sizes.
An optimistic restore transfer of 12 TiB across an actually sustained 1 GiB/s channel takes at least 12,288 seconds, about 3.41 hours, before decompression, listing, metadata restoration, checksum verification, table startup, and warming essential caches. If a service requires RTO below two hours, this storage layout cannot meet it through that serial transfer path alone. Better bandwidth, parallel recovery, reduced restore set, or an already provisioned recovery site would have to be included in the tested design.
RPO specifies acceptable data loss measured from the restored boundary; RTO specifies acceptable time until service recovery. Neither is proven merely by retaining backups. A 10 TB dataset restored over an effective 1 GB/s transfer path requires nearly three hours for transfer alone, before metadata reconstruction, validation and cache warming. Cross-region restoration adds network and identity-management dependencies. Measure real recovery drills against a documented reference dataset and record discrepancies, not just successful command completion.
29.8. Backup Content and Restoration Verification
A valid archive is not the same as a usable restored database. Verify representative tables, logical keys, aggregates, part health, access controls, and dependencies. Restore into an isolated environment and reconcile results against a known source boundary. Record elapsed time and operational intervention so recovery targets are evidence-based.
A restore exercise should begin with the expected source snapshot boundary and end with evidence that the restored data represents it. Verify the presence of required schemas, tables, permissions, parts, and replicas. Run fixed analytical checksums or keyed samples and compare business aggregates against the saved baseline. Measure recovery time including object listing, transfer, metadata reconstruction, and query readiness. Successful completion of a RESTORE command alone does not demonstrate the application has met its recovery objective.
Backup verification has two layers. Physical verification confirms that the expected files, manifests, checksums and referenced objects can be read; logical verification confirms that table schemas, key samples, event counts and aggregate results match the intended source boundary. A successful restore command alone proves neither application readiness nor acceptable recovery time. Compare restored data against a reference watermark, then execute representative analytical queries and client connections. Measure recovery time under realistic network and storage bandwidth rather than assuming a best-case copy rate. Backups should also be tested with access credentials and encryption keys stored in the same operationally realistic way as the production recovery plan.
Unit 30: System Monitoring, Performance Diagnostics, and Troubleshooting
As resource utilization approaches capacity, queueing and tail latency rise faster than median latency, so p95 and p99 often expose saturation earlier.
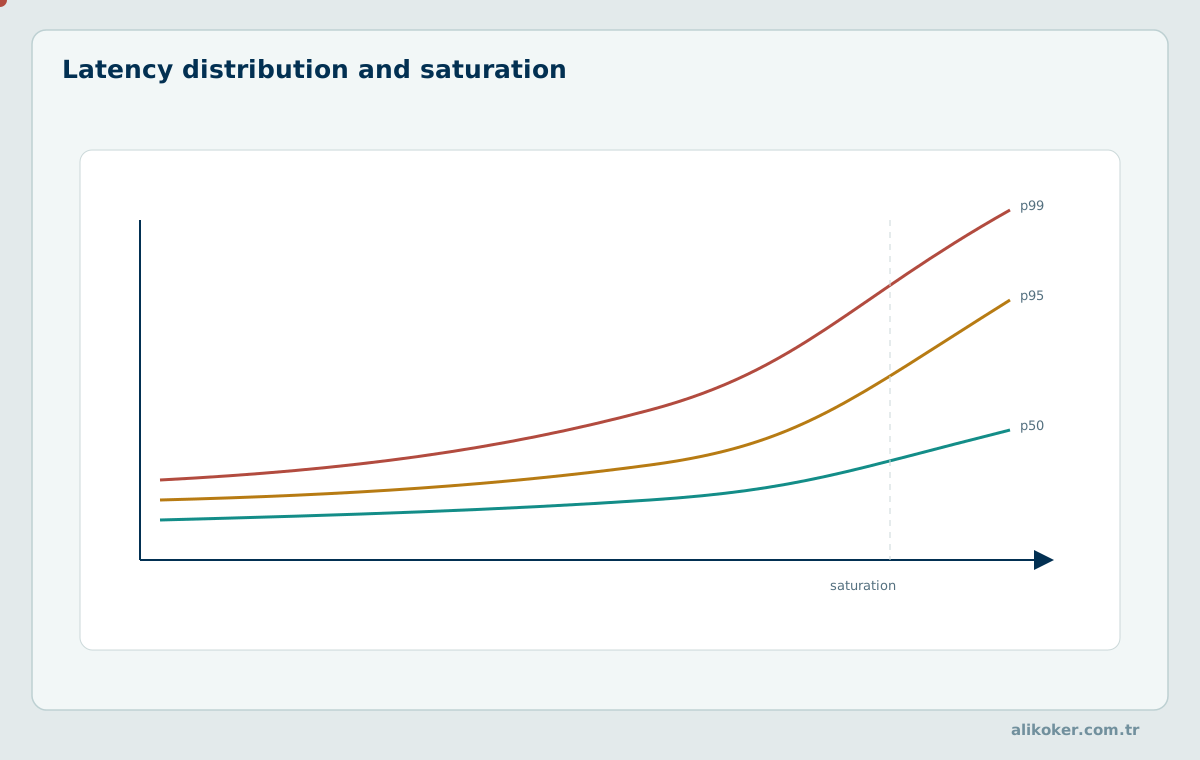
Diagnostic evidence should connect query behavior to CPU, disk, memory, concurrency, and background tasks. ClickHouse system tables and profile events provide substantial insight, but log collection has cost and may contain sensitive SQL data. Observability must remain proportional to the deployment's safety and operational constraints.
30.1. system.query_log, Parts, Merges, and Metrics Tables
system.query_log records useful query metrics when enabled, while system.parts and system.merges expose storage state. Other system tables provide settings, events, and replication progress. Some records are buffered and persisted asynchronously. Always qualify observation windows and distinguish active from inactive parts.
SELECT
    event_time,
    query_id,
    query_duration_ms,
    read_rows,
    read_bytes,
    memory_usage
FROM system.query_log
WHERE type = 'QueryFinish'
  AND event_time >= now() - INTERVAL 1 HOUR
ORDER BY query_duration_ms DESC
LIMIT 20;
[16] [45] [46]
system.query_log records completed or otherwise logged query information subject to server configuration, while system.parts, system.merges and related tables describe storage and background work. These observations have different time scales: a snapshot of active parts cannot reconstruct every completed merge, and a query log may be sampled or flushed asynchronously. For incident analysis, relate query IDs and timestamps to CPU, memory and storage metrics without exposing raw secrets contained in query text. Distinguish active data parts from detached or inactive parts when computing storage usage. Inspect query read bytes and rows together; very few returned rows can still require a large scan.
For a suspicious query, collect its ID, start and finish time, rows and bytes read, peak memory, and any server error classification. In parallel, inspect active part counts, background merges and disk capacity during the same interval. If the output contains ten rows but reads most of the table, the probable cause is pruning or plan behavior; if it reads little data but consumes huge memory, grouping or join state may be responsible. Query logs should be reviewed with least-privilege access and sanitized before sharing because SQL literals can contain sensitive data.
30.2. Query Profiling, Sampled Stacks, and Flame Graphs
Sampling profilers attribute CPU or other sampled resource use to call stacks, with sampling bias and resolution limits. Flame graphs help locate hotspots but do not directly prove causation. Compare samples across identical workload phases and account for cache warmup. Profiling can introduce overhead and should be permitted only where operational policy allows it.
Sampling profilers collect execution stack observations and can highlight CPU-intensive code paths without tracing every function call. Flame graphs visualize aggregated stack widths rather than directly proving end-to-end query latency. A hot memory allocator path may reflect hash aggregation or string processing rather than a storage problem. Profile representative load with acceptable sampling overhead and correlate stacks with query IDs or workload intervals where possible. Ensure diagnostic dumps do not disclose sensitive literals from SQL queries.
30.3. jemalloc Allocation Profiling and Heap Inspection
Allocation profiles can identify which functions or phases consume memory and create transient allocation spikes. Tracked query memory, allocator-reserved memory, and process resident memory are not identical measures. Fragmentation and retained caches can affect process size after a query ends. Use isolated reproductions when production profiling is restricted.
jemalloc allocation profiles help characterize the volume and lifetime of memory allocations but must be interpreted alongside process RSS and application memory accounting. Fragmentation and retained arenas can cause resident memory to remain high after a query completes. This behavior is not automatically a memory leak. Reproduce a steady workload, allow expected caches and allocators to reach equilibrium, then inspect whether unbounded growth persists. A server-level OOM incident may originate from several concurrent allocations rather than one identifiable query.
30.4. Query Logs, HTTP Metrics, and Prometheus Export
Metrics can expose throughput, error rates, query latency, replication lag, and merge backlog. Cardinality of labels must be controlled to avoid turning observability into an unbounded workload. Query literals and tenant identifiers require redaction or limited collection. Systems that prohibit production telemetry expansion can still be assessed from existing approved diagnostics without adding new agents.
SELECT event_time, query_id, query_duration_ms,
       read_rows, read_bytes, memory_usage
FROM system.query_log
WHERE type = 'QueryFinish'
  AND event_time >= now() - INTERVAL 1 HOUR
ORDER BY query_duration_ms DESC
LIMIT 20;
Query logs and HTTP metrics serve different observability roles: the former can preserve request-specific work, while the latter often aggregates counters and gauges. Prometheus export must control label cardinality and avoid exposing raw SQL or credentials. Metric scrape frequency can hide short memory peaks, whereas query logs may flush after a delay. Correlate time ranges and account for this sampling mismatch before interpreting a missing metric spike as proof that no overload occurred.
30.5. OOM Detection, Overcommit, and Memory-Leak Diagnosis
An out-of-memory event can originate from one large query, aggregate concurrency, background merges, or allocator behavior. Sustained post-query process memory is not automatically a leak. Inspect event chronology, workload mix, tracked allocations, and operating-system limits. Fault recovery should prioritize predictable service behavior over forcing an unsafe query to complete.
An out-of-memory failure may result from legitimate query state exceeding capacity, allocator fragmentation or uncontrolled concurrency, not necessarily a leaked object. Distinguish application-enforced memory limits, kernel OOM kills and disk-full conditions caused by external spilling. Preserve the workload shape and server settings when reproducing the incident. If memory returns to a stable baseline after the workload drains, the issue may be insufficient capacity for the peak rather than unbounded retention. Recovery policy should protect unfinished ingestion from unsafe replay.
30.6. Monitoring Background Merges and Mutations
Observe part counts, active merges, mutation backlog, disk throughput, and failures. A high ingestion rate can degrade SELECT latency through resource competition even without locking. Correlate write bursts with part creation and merge demand. Remediation should target partitioning and batching before indiscriminately expanding worker pools.
Background merges, mutations and replicated part fetches compete for storage and CPU with user queries. An operator may see normal SELECT throughput on an idle node and degraded p99 only during high write activity. To attribute the change, correlate merge logs and part counts with query read bytes, disk queue depth and memory pressure. A long-running mutation is not necessarily blocked: it may be rewriting substantial compressed input while consuming limited configured resources. Avoid blindly raising background worker counts; higher concurrency can worsen I/O contention and overall throughput.
30.7. Query Throughput, Latency Distributions, and Saturation
Report throughput and tail latency together under specified offered load and concurrency. A rising queue delay can precede outright failures. p99 estimates require enough independent observations and attention to coordinated omission. CPU utilization, I/O queueing, and memory pressure help explain whether saturation arises from compute, storage, or admission policy.
For 10,000 independent latency samples, the empirical p99 is determined by approximately the hundredth slowest observation, making it sensitive to overload phases, measurement error, and censored timeouts. Coordinated omission occurs when a closed-loop test stops sending new requests while waiting on a slow response, thereby underrepresenting the load that real users would have generated. Where feasible, measure open-loop arrival rates and include failed or timed-out requests. Compare both service time and queue wait to locate the source of tail latency.
Throughput is completed work per unit time, not merely requests accepted at an ingress endpoint. A server may increase its request arrival rate while completed throughput remains flat, causing queues and p99 to grow. Plot offered load, completion rate, active concurrency, timeouts and memory pressure together. Use realistic mixes of short dashboard queries and long scans because service classes contend differently. A median latency below target is insufficient when the operational objective also constrains tail latency during bursts.
30.8. Performance Regressions and Service-Level Objectives
A reproducible regression test fixes data, queries, settings, version, and hardware as far as practical. Compare result correctness before latency. Service objectives should define relevant percentiles, query classes, error behavior, and freshness, not only average response time. Changes that improve one benchmark while degrading shared workload behavior may be unsuitable for production.
A performance regression requires a stable comparison baseline. Record the affected queries, input row counts, compressed bytes, active parts, settings, concurrency and cache conditions before interpreting a latency increase. Changes in schema, sorting key or cardinality may alter a plan even when SQL text is identical. Use percentile distributions and confidence intervals where available; a single slow execution cannot establish a statistically reliable regression. A practical service-level analysis distinguishes errors and timeouts from completed-query latency, since excluding failed requests may make the reported p99 misleadingly optimistic.
Unit 31: ClickHouse Administration and Development Tools
Command-line tools support local analysis, benchmarking, formatting, compression experiments, storage inspection, and coordination administration. Each tool has distinct requirements and safety properties. Names, availability, and flags may change by release, so examples must be checked against the installed executable.
31.1. Serverless SQL with clickhouse-local
clickhouse-local can process files and temporary tables using ClickHouse facilities without a continuously running server instance. It is useful for exploratory parsing, conversion, and isolated SQL tests. Behavior involving distributed coordination or persistent cluster state cannot be inferred from a local run. Pin the binary version for reproducibility.
clickhouse local --query \\"SELECT count() FROM file('events.parquet', Parquet)\\"clickhouse-local evaluates supported SQL over local files without requiring a persistent server. It is suitable for format exploration, small-scale data transformations and reproducible demonstrations of expressions. The absence of a server also means it cannot validate distributed replication, cluster security policies or network ingress performance. Distinguish file parsing time from query execution cost, and record the binary version so changes in format support do not silently alter results across machines.
31.2. clickhouse-benchmark and Experiment Automation
A query benchmark tool can repeat representative SQL at specified concurrency and report timing distributions. Experimental results remain sensitive to warm caches, background tasks, network effects, and statistical sample size. Test the complete workload class instead of only a favorable point query. Never run high-load benchmarks against a critical production service without an approved capacity window.
A fair test separates data preparation from timed execution, unless data loading is part of the question being evaluated. Repeat the SQL after plan compilation and cache warmup when reporting warm latency, and explicitly clear or characterize caches for cold behavior. Use a representative query suite rather than a single count query. Record actual output validity and errors because a failed query can appear artificially fast. On shared production infrastructure, benchmark automation must obey deployment policy and avoid introducing uncontrolled high-concurrency load.
A benchmark client should issue a controlled workload and collect distributional timing, not merely repeat one SELECT as quickly as possible. Concurrency, think time, cache state, SQL order and result validation must be specified. clickhouse-benchmark can help produce repeatable request patterns under supported options, but it does not automatically correct for workload-selection bias or coordinated omission. Confirm that returned results are semantically equivalent between alternatives and preserve timing samples for statistical analysis.
31.3. clickhouse-format, Compressor, and Obfuscator
Formatting tools normalize SQL text, compression tools compare supported codec behavior, and obfuscation facilities can help produce less revealing test data. Formatting success is not semantic SQL validation. Obfuscation is not a universal guarantee of irreversible anonymization. Treat generated datasets according to their actual privacy properties and inspect output before sharing.
clickhouse-format validates and standardizes SQL formatting but cannot establish that the query is semantically correct or that every referenced table exists. Compression utilities examine byte-level transformations and should be tested with representative column distributions. Obfuscation tools can reduce the exposure of sensitive values in shared diagnostic material, but their output still requires privacy review; structural metadata and uncommon identifiers may remain revealing. A CLI utility should be selected for its concrete operation instead of treating every command in the ClickHouse binary as a database query executor.
31.4. clickhouse-disks and Filesystem Inspection
Disk tooling can inspect supported storage representations and aid controlled diagnostics. Manual modification of underlying part files bypasses database consistency mechanisms and should be avoided. Compare tool output with system-table metadata and backup copies when diagnosing corruption. Paths and naming conventions are implementation details that can change between releases.
Disk inspection tools can enumerate configured storage endpoints and assist in diagnosing misplaced or inaccessible parts. They cannot substitute for the server's logical catalog or a tested backup. A directory full of compressed files may include inactive and detached data, so filesystem size is not the same as active-table logical size. Compare low-level listings against supported system tables and verify that recovery references all required metadata and remote objects.
31.5. clickhouse-keeper-client and HTTP API
Keeper client tools are intended for metadata/coordination diagnostics and require appropriate authorization. Editing coordination state directly can cause severe replication inconsistency. HTTP query APIs are separate data-service interfaces with their own authentication, limits, and transport behavior. Do not treat a reachable endpoint as proof that an operation is safe to automate.
A Keeper client is intended for inspecting or administering coordination state under appropriate permissions; it is not a general substitute for ClickHouse SQL execution. Operations on shared metadata can affect replicas across a cluster and should be treated as sensitive administration. HTTP APIs likewise differ by endpoint and request semantics. Restrict access, audit administrative changes and test recovery commands on an isolated cluster before applying them to production coordination state.
31.6. ODBC Bridge, Backupview, and Static File Loading
Support utilities and bridges provide interoperability or inspection functions but may not be standard tools in every distribution. Verify version and platform availability. Where a bridge executes against remote systems, credentials and remote query semantics must be considered. Auxiliary tools should not become unreviewed privileged bypass paths in the architecture.
ODBC bridges, backup viewers and file-loading utilities address distinct integration needs and may have additional process or connector dependencies. Check the selected release's supported commands rather than assuming every historical example remains available. External driver processes can introduce their own authentication, network and resource limits. When moving data through file loaders, capture schema, checksum and source file identities so partial processing can be detected and resumed safely.
31.7. clickhousectl and Client Development
Administrative wrappers can simplify deployment and operational workflows but vary by provider and release. Client code must handle network interruption, streaming results, cancellation, and ambiguous insert outcomes. Bound concurrent requests according to server capacity. A successful client unit test does not establish engine correctness under retries and distributed failures.
Client libraries should implement bounded timeouts, explicit type handling and correct cancellation/retry behavior. A convenience management tool may be useful for deployment workflows but does not define the database's transaction or replication guarantees. Version pinning matters because a client library update can change result decoding or connection defaults independently of the server. Treat credentials, TLS verification and failure recovery as core application responsibilities rather than optional wrappers around SQL execution.
31.8. Command-Line versus Web-Interface Behavior
Different clients may apply different default formatting, connection parameters, result limits, and session settings. Compare the actual SQL and effective settings before attributing differing results to the engine. Browser UIs can hide truncation or sampling if not configured carefully. Large downloads should use streaming with a backpressure-aware consumer.
[41]
Interactive terminals, browser SQL consoles and automation clients differ in output truncation, pagination, timeout behavior and error presentation. A console that shows the first thousand records is not evidence that the underlying query processed only those records. Long-running operations must be tracked by query ID or operation state rather than by the presence of an open browser tab. Diagnostic exports should exclude credentials and unnecessarily sensitive query text. Test the same SQL through the intended application driver before assuming that behavior observed in a web interface will transfer unchanged.
Unit 32: ClickHouse and Other Analytical Database Systems
An analytical system should be selected by workload invariants and total operating cost rather than a single vendor benchmark. Column stores, in-process engines, distributed search systems, managed warehouses, and lakehouse query services differ in indexing, concurrency, update behavior, and data placement.
32.1. Apache Druid, Pinot, Doris, and StarRocks
These systems address overlapping but not identical low-latency analytical workloads. Differences include indexing strategy, ingestion path, distributed architecture, mutation facilities, and query execution. Druid and Pinot are often evaluated for event analytics, while Doris and StarRocks expose additional SQL/data-warehouse capabilities. Compare concrete supported features and identical logical results for the intended release.
Apache Druid and Pinot emphasize different indexing and real-time analytical serving paths; Doris and StarRocks provide other distributed SQL-oriented analytical architectures. Their suitability depends on the latency distribution, ingest transformations, mutation requirements and dimension joins of the actual workload. A system designed for real-time dashboards can outperform another on a tuned query while performing worse on a broad ad hoc aggregate. Compare physical storage, indexing maintenance and operational failure modes rather than reducing the evaluation to a single headline latency factor.
32.2. DuckDB, Vertica, Snowflake, BigQuery, and Redshift
DuckDB emphasizes embedded analytical execution over local or remotely accessible data; ClickHouse also has an embedded chDB variant. Vertica is a distributed column-oriented DBMS. Snowflake, BigQuery, and Redshift are managed analytical platforms with different elasticity, storage, and billing models. An in-process benchmark should not be extrapolated to networked production service costs without accounting for data loading and concurrency.
[47]
DuckDB is particularly suitable for embedded analytical processing of local or object-store datasets without maintaining a distributed server. Vertica and managed warehouses such as Snowflake, BigQuery and Redshift offer different storage/compute separation, billing and concurrency models. An embedded engine's low startup cost does not establish its suitability for many remote concurrent service consumers. Conversely a managed service can simplify operations while introducing cost and data-egress considerations. Evaluate representative queries and the required deployment topology together.
32.3. Oracle, PostgreSQL, MySQL, and Analytical Extensions
General-purpose relational DBMSs can support advanced analytics through query optimizers, indexes, partitions, materialized views, extensions, and specialized hardware. Their transaction and row-update guarantees often remain essential to operational systems. ClickHouse is most useful as a complement when large scans and repeated aggregates interfere with primary OLTP capacity. Benchmark semantically equivalent workloads using each system's documented optimizations.
Oracle, PostgreSQL and MySQL can perform analytical queries and may expose indexing, partitioning or column-oriented optimizations in particular products and versions. Their use as OLTP sources does not imply that every analytical report must migrate. A selective B-tree query over a small current-state table can outperform a column scan over an enormous historical event table. Specialized ClickHouse serving is most valuable when the measured workload exhibits large scans, aggregation and high compressibility. Compare source OLTP impact and CDC maintenance cost as part of the business decision.
32.4. Elasticsearch and Lucene: Inverted Indexes and Document Storage
Elasticsearch is a distributed search and analytics engine built on Lucene, not a conventional relational OLTP DBMS or a column-oriented ClickHouse-style OLAP database. It nevertheless has persistent document storage and database-like capabilities, including aggregation and vector search. Inverted indexes excel at retrieval by terms and tokens, while ClickHouse column scans and ordered storage excel at other analytical patterns. Neither category label establishes universal superiority.
[41]
Elasticsearch is a distributed search and analytics engine built on Lucene, not a conventional relational OLTP DBMS or a MergeTree-based columnar OLAP engine. Its inverted index maps terms to matching documents; document storage, doc values and aggregations serve related but distinct access patterns. Elasticsearch also exposes document and vector-search capabilities, so asserting that it has no database-related functions at all would be imprecise. Full-text relevance scoring, tokenization and near-real-time indexing differ from ClickHouse's scan-and-aggregate strengths. Compare query semantics first: a tokenized search query and an exact SQL predicate are not interchangeable workloads. Indexing overhead, heap/cache behavior, refresh settings, retention, and ingestion cost must accompany any response-time comparison.
An Elasticsearch index typically uses Lucene segments with inverted term postings and structures supporting stored documents or field-based access. Analyzed text searches must define token filters, stop words, stemming and matching semantics, none of which follows automatically from a ClickHouse SQL equality predicate. Elasticsearch is often used as a primary operational search datastore, but it is not the same architectural category as a traditional relational transactional database. Calling it “not a database” without qualification obscures its persisted documents and retrieval capabilities; the precise distinction is that it is a distributed search and analytics engine rather than a conventional general-purpose OLTP DBMS.
Resource comparisons must separate the primary task: full-text relevance, exact structured filtering, time-series aggregation or vector nearest-neighbor search. The engines may both support parts of the task, but index construction, refresh, compression and query scheduling differ. An Elasticsearch-versus-ClickHouse cost result should state versions, hardware, replicas, data retention and query selection. A 2024 log benchmark is not necessarily representative of a 2026 release with materially different optimizations.
32.5. Full-Text Search versus Column-Oriented OLAP
Full-text retrieval optimizes matching and ranking documents from tokenized content; OLAP commonly evaluates large-scale aggregates over typed dimensions and measures. Workloads may require both indexing modes. Compare relevant query semantics, text analyzers, update behavior, cardinality, and result ranking as well as latency. ClickHouse's evolving text-index features should be qualified by release and query pattern.
[19] [28] [48]
Full-text search normally starts with tokens, analyzers, inverted postings and relevance ranking; analytical SQL normally starts with typed expressions, column scans, joins and aggregations. ClickHouse provides text-indexing and search-related features in specific versions, while Elasticsearch can aggregate fields through its own column-like structures. This overlap does not erase the differences in default physical design and primary workload. When evaluating the same event corpus, construct both an exact predicate-and-grouping benchmark and a linguistic relevance-search benchmark. Optimizing one does not establish superiority for the other. Be especially careful about stemming, case folding, phrase matching and analyzer configuration, since these may silently change which records count as matches.
An inverted index is particularly suited to determining which documents contain a token or term combination without scanning each document's raw text. The search engine must also handle analyzers, tokenization, phrase relationships and ranking; two engines configured with different analyzers do not answer the same full-text query. A column engine is particularly effective at scanning selected typed fields and computing aggregates over many events, especially when physical ordering narrows candidate granules. Elasticsearch's doc values can serve aggregation workloads, while ClickHouse has version-dependent text and vector indexing facilities. The existence of these capabilities does not erase their different default architectures.
A meaningful study should distinguish a search workload involving BM25-like relevance scores from a histogram query aggregating count by organization and hour. Define the exact match set and query semantics, then evaluate index-building cost, ingestion overhead, disk bytes, heap/memory pressure and p95/p99 under concurrency. A vendor's stated ratio applies only to the scenario and configurations actually measured.
32.6. Reliability, Concurrency, Ingestion, and Query Profiles
A fast single-query result may conceal poor concurrent p99 latency or high data-replication cost. Evaluate data freshness, ingest throughput, availability, backup recovery, cost per comparable query class, and administrative workload. Systems that expose different consistency guarantees cannot be compared fairly without normalizing result requirements or documenting the difference.
Reliability and latency are not independent. A design achieving very low median SELECT time but offering no tested restore process may fail a critical service objective. Frequent mutations can change the ingest and compaction cost of a column-oriented architecture, while high-concurrency interactive queries can overload memory even when isolated throughput is impressive. Use a weighted matrix including update semantics, load freshness, p99, backup RTO, operator effort and cost. Report confidence ranges and failure cases rather than declaring a universally fastest engine.
32.7. System Selection and Comparison Matrix
A useful comparison matrix identifies: source-of-truth requirements, query patterns, update frequency, acceptable staleness, index build cost, peak memory, retention, compliance, fault tolerance, and operational expertise. Assign measurable acceptance criteria to each property. A product ranking is not meaningful without a weighted workload profile and an explicit exclusion criterion for unmet guarantees.
A database selection matrix should score query mix, mutation volume, freshness requirements, concurrency, indexing behavior, source-of-truth obligations, disaster recovery and operations cost separately. DuckDB is especially useful for embedded analytics over local or object-store files, while systems such as Pinot and Druid emphasize different real-time serving paths and indexing strategies. A cloud warehouse shifts parts of operations to a managed service but does not eliminate billing, data movement or query-engine limits. Oracle and PostgreSQL remain appropriate transactional sources even when some expensive reports migrate to a specialized analytical system. A decision should be grounded in weighted representative workloads, not a vendor's best single-chart benchmark.
32.8. Limits of Generalizing Comparative Benchmarks
Vendor publications may report ClickHouse versus PostgreSQL or Elasticsearch improvements of several-fold or more for specified tests. These figures are observations under stated data, hardware, indexing, caching, and query conditions, not universal multipliers. Reproduce results with identical logical outputs, cold/warm cache characterization, concurrency, and total-cost accounting. Cite the publisher and date rather than presenting marketing ratios as intrinsic physical laws.
Suppose a published comparison states that ClickHouse is ten times faster than another platform. That ratio is meaningful only for the precise set of query templates, index structures, hardware, concurrency, data distribution, and correctness target in the published methodology. If the alternative platform was configured to retain full-text features that the OLAP workload does not use, the comparison measures a deployment trade-off as well as SQL efficiency. Cite ClickHouse as the publisher of its own results and rerun the workload locally before adopting the ratio as an engineering planning assumption.
Published vendor measurements are empirical claims about specified datasets, software versions, hardware configurations and query selections. A quoted “up to 1000×” improvement may be true for a selected case while having little predictive value for another workload. Match SQL semantics, record counts, result cardinality, materialization policies, compression and warmed cache state before comparing elapsed times. Report insert throughput and update cost as well as SELECT performance; an engine that answers one aggregation quickly may impose a larger continuous ingest cost. Repetition, measurement variance and price methodology are necessary for meaningful total-cost comparisons. Do not convert vendor-reported figures into universal guarantees or attribute them to independent research unless the benchmark genuinely was independently conducted.
Unit 33: Real-Time Analytics and End-to-End System Architectures
The transactional source can retain correctness responsibility while analytical scan load is isolated. CDC feeds a ClickHouse copy without forcing long scans onto the OLTP path.
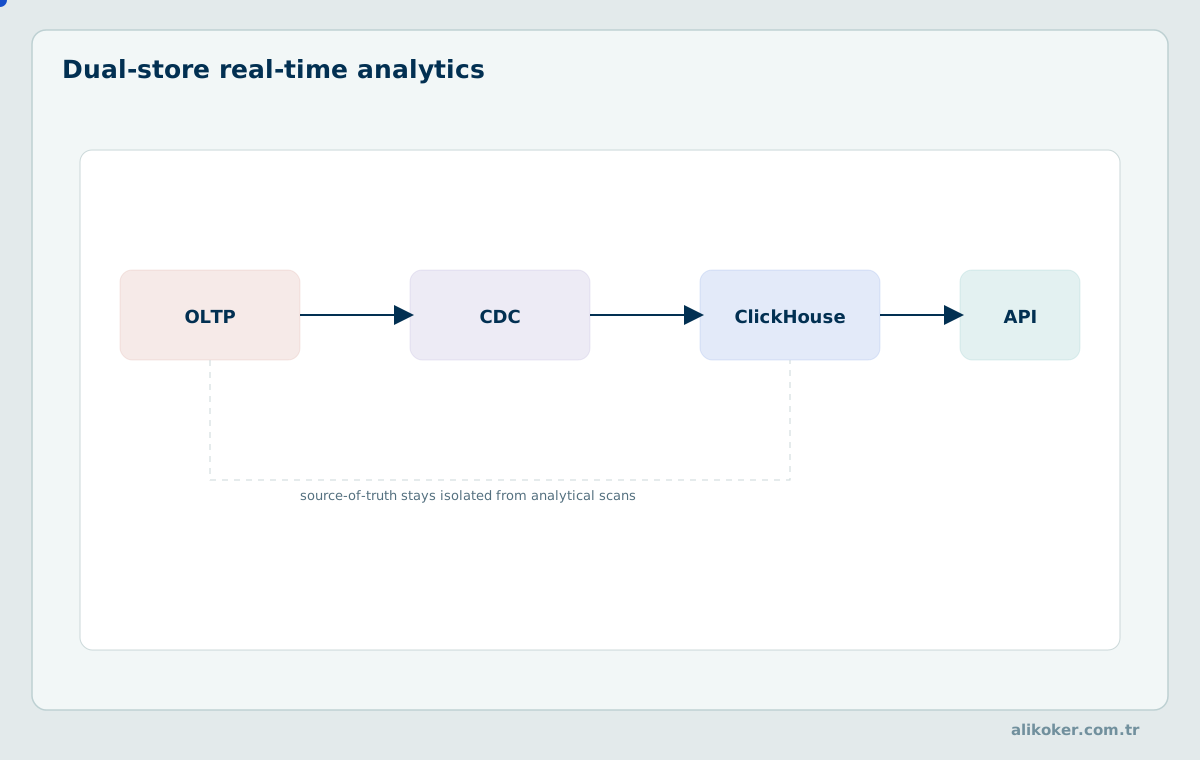
ClickHouse is useful for analytical reads over high-volume append-oriented events, logs, time series, and derived statistics. The architecture must separate operational authority from analytical convenience, preserve original event identity, and specify recovery from late data or incomplete streaming pipelines.
33.1. High-Volume Log and Event Analytics
A log schema should capture event time, ingest time, source, severity, stable event identity, and typed searchable attributes. Logs are often append-oriented but not necessarily immutable: redaction, correction, and deletion can occur. Separate long unstructured payloads from frequently filtered dimensions when appropriate. Retention, access controls, and workload isolation are as important as compression ratio.
High-volume event analysis should use a declared event identity, typed timestamp and stable dimensions such as organization, service and event category. Retaining the raw stream permits later reconstruction when a parser or mapping rule changes. Sort order and retention must follow the dominant investigation windows, not merely the arrival order. Late-arriving events should remain visible through an explicit freshness model. Aggregate dashboards and forensic event reconstruction can share a dataset while requiring different read paths and retention periods.
33.2. Time Series, Continuous Aggregation, and Retention
Time-series queries depend on event-time semantics, temporal resolution, and gaps in observations. Downsampling should preserve the aggregates needed by later queries; averaging averages is generally incorrect without counts. Late arrivals can alter previously published windows. Design rollups with idempotent replay and time-zone-aware retention logic.
Time-series analytics must distinguish event time, ingestion time and processing time, especially for out-of-order or delayed records. A window grouped by local date may have variable duration around daylight-saving changes, while a UTC-aligned interval has different business semantics. Precomputed rollups reduce scan cost but must preserve enough state to account for late corrections and duplicate events. Retention policy should identify which raw intervals can be dropped after aggregates are trusted and what reconstruction source remains available. A dashboard showing recent events should declare its freshness watermark rather than interpreting the most recent timestamp in one partition as proof that all sources have caught up.
33.3. Historical Analysis of Cybersecurity and Network Events
Network metadata, security events, and alerts generate high-cardinality attributes and bursty ingestion patterns. Analytics can detect patterns through grouping, distinct counts, temporal correlation, and anomaly statistics. The analytical store should not be mistaken for an authorization or transactional decision engine. Protect sensitive identifiers, document sampling bias, and keep forensic provenance and timestamp accuracy intact.
Related statistical anomaly detection methods are discussed in Anomaly Detection.
Security event analytics often combines network endpoints, protocol attributes, process activity and time windows. High-cardinality identifiers are essential for investigations but can be expensive grouping keys or metric labels. Preserve unaltered event identifiers and normalized searchable fields separately from large textual payloads. A correlation derived from timestamps alone should be presented as a statistical association, not proof of causation. Data-access controls and retention constraints apply to raw events as well as derived anomaly scores.
33.4. Observability, Telemetry, and Metric Aggregation
Metrics, traces, and logs differ in structure and cardinality. High-cardinality labels can make exact grouping expensive, while coarse rollups can remove forensic detail. Plan retention and aggregation according to permitted observability scope and actual incident questions. In restricted production environments, avoid introducing additional instrumentation solely to support a lesson or benchmark.
Observability datasets often combine high-cardinality traces, log messages and lower-cardinality metrics. Their retention and query patterns differ, even when ingested into one analytical cluster. Raw request identifiers may be valuable for forensic correlation but unsuitable as primary sort keys for time-window aggregations. Large metric-label combinations can create excessive distinct-group memory and downstream monitoring expense. Store typed event-time and service attributes in dedicated columns when they drive most filters, and control access to sensitive identifiers carried in log bodies. Tail-latency analytics should distinguish missing telemetry, sampling and instrumented application overhead from true absence of a system event.
33.5. Real-Time Dashboards and API Delivery
Dashboards typically execute small, repeated aggregates over recent data. Materialized summaries and correct sorting keys can reduce response latency, but users also need declared refresh lag and partial-data behavior. API endpoints should enforce tenant scope, bounded queries, pagination or limits for large results, and cancellation. Tail latency must be measured at the client-visible boundary.
A real-time dashboard is constrained by both query execution time and data freshness. Displaying a fast aggregation over a stale replica may be operationally incorrect. Define an acceptable source watermark for each report and expose whether the required streams have reached it. Cache or materialize repeated aggregates when appropriate, but include invalidation and late-event correction behavior. Protect APIs with bounded result sizes and concurrency limits; a report request must not be able to trigger unlimited memory usage merely by varying dimensions.
33.6. Billion-Row Event Schema, Queries, and Index Analysis
A credible large-scale experiment includes a reproducible generator, declared data distribution, physical sort/partition choices, and a suite of queries with expected answers. Measure compressed size, inserted rows, parts per partition, rows/bytes read, memory, and p95/p99 under concurrency. One synthetic uniform distribution may hide severe skew or late-arrival behavior found in real systems.
CREATE TABLE event_analytics
(
    event_time DateTime64(3, 'UTC'),
    source_id UInt32,
    tenant_id UInt32,
    event_id UUID,
    event_type LowCardinality(String),
    status_code UInt16,
    processing_time DateTime64(3, 'UTC')
)
ENGINE = MergeTree
PARTITION BY toYYYYMM(event_time)
ORDER BY (tenant_id, event_time, event_type, source_id, event_id)
TTL event_time + INTERVAL 180 DAY;
SELECT
tenant_id,
toStartOfHour(event_time) AS hour,
count() AS events,
countIf(status_code >= 500) AS errors,
round(100.0 * errors / nullIf(events, 0), 3) AS error_pct
FROM event_analytics
WHERE tenant_id = 42
AND event_time >= toDateTime64('2026-10-01 00:00:00', 3, 'UTC')
AND event_time < toDateTime64('2026-10-02 00:00:00', 3, 'UTC')
GROUP BY tenant_id, hour
ORDER BY hour;A billion-row event exercise should specify the schema, physical ordering, partition policy, index choices, data skew, query family and validation baseline. One useful design groups by organization, service and time, then compares ORDER BY candidates while holding source rows and server resources constant. A selective service-time query should be measured by selected marks and read bytes, whereas a global group-by may be CPU- and memory-bound regardless of its filter. Include an insertion test to expose the cost of maintaining the chosen layout. Use stable generated identifiers and deterministic event distributions; otherwise query correctness and runtime cannot be reproduced from the reported SQL alone.
33.7. Dual Storage: Oracle OLTP and ClickHouse OLAP
Oracle retains authoritative writes and transactional invariants while ClickHouse serves selected analytical reads from a CDC replica. The pipeline needs source-watermark reconciliation, backfill cutoffs, schema-change handling, idempotency, and deletion semantics. The total system cost includes both infrastructures and the CDC connector's effect on source redo and I/O demand.
A dual-database architecture keeps Oracle responsible for transactional writes and business invariants while ClickHouse serves historical analytical reads. CDC connects these responsibilities through ordered source changes and a separately observable applied position. The architecture can reduce analytic competition on the source without making source extraction free. It must define failure behavior when the analytical copy lags or becomes unavailable. The application should not silently redirect a strongly consistent transactional query to a stale analytical replica.
33.8. Data Lineage, Restore, and Correctness
Lineage records source tables, transformations, version mappings, and the chain of derived aggregates. A restored analytical target must replay changes only from an established consistent checkpoint. Verify not only row counts but keyed identity, source versions, and aggregate invariants. A system that answers queries quickly but cannot reproduce how its data was obtained is unsuitable for audit-sensitive analytics.
For audit-sensitive pipelines, attach source-system identity, extraction time, commit watermark, transformation version, and target table version to each ingestion batch or verifiable lineage record. After disaster recovery, replay should resume from the watermark represented by the recovered analytical data, not simply from the latest broker offset. Independently check that duplicates, deletions, and delayed events reconstruct the intended analytical state. An accurate lineage chain allows an investigator to explain why a historical report changed after late source corrections.
Data lineage links a reported value to source tables, extraction boundary, transformations and versioned analytical state. It enables reconstruction after a mapping error or a restored backup exposes older data. A replay log and source snapshot are useful only when they can reproduce the same identity and ordering rules. Validate lineage at selected logical keys and source commit positions, not only by comparing final aggregate totals. Retention choices should preserve the reconstruction window promised by the disaster-recovery plan.
Unit 34: Experimental Performance, Capacity, and Cost Analysis
A single query time does not define capacity. Throughput and p50/p95/p99 latency should be measured together as concurrency rises toward saturation.
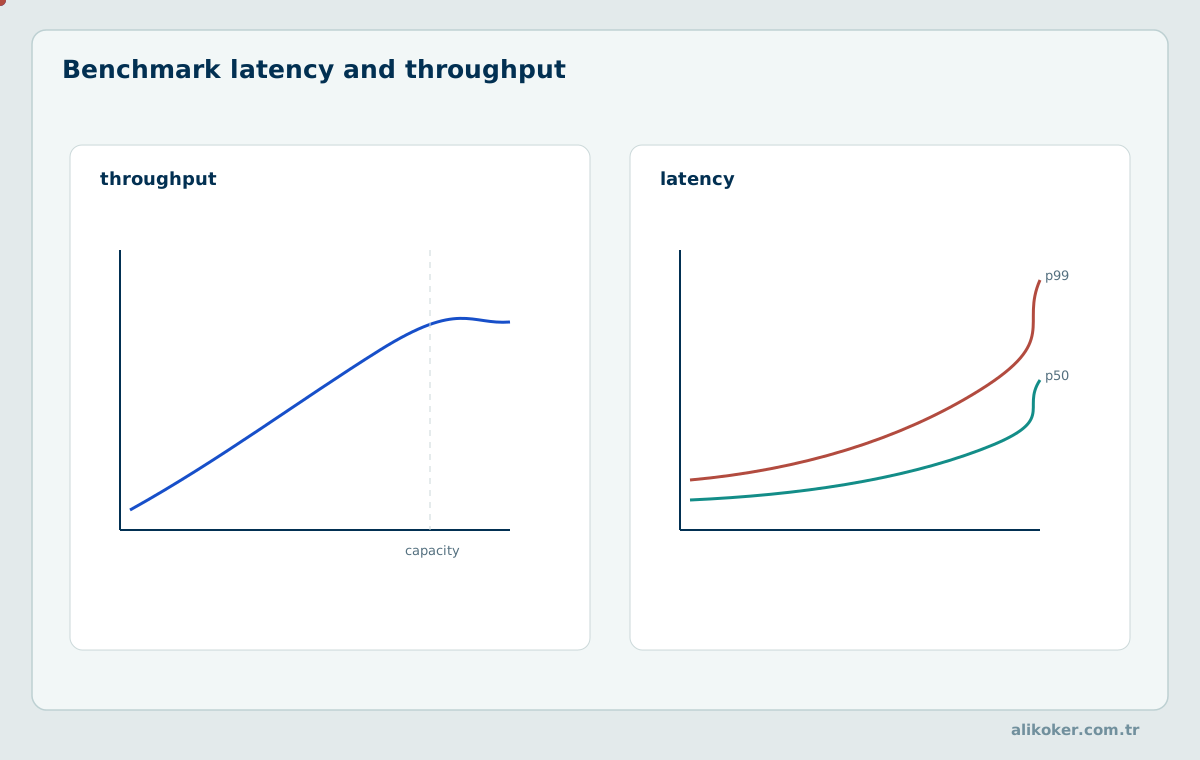
Performance engineering must distinguish an algorithmic property from a vendor's selected benchmark outcome. An experiment is meaningful only when query semantics, data distribution, concurrency, system version, caches, and success criteria are sufficiently specified for independent repetition.
34.1. Reproducible Benchmarking and Workload Design
Version the dataset generator, raw data, schema, ingestion scripts, SQL, settings, hardware profile, and measurement harness. Include workloads covering selective filters, broad scans, high-cardinality grouping, joins, and concurrent queries. Verify exact or explicitly approximate result semantics before comparing runtimes. A benchmark without error and correctness accounting measures only some aspect of execution speed.
clickhouse-benchmark --host localhost --concurrency 8 --iterations 100 --query \\"SELECT count() FROM default.events\\"A reproducible analytical benchmark fixes server and client versions, dataset generation seed, schema, hardware, row count, cold/warm cache policy, concurrency, settings and query order. Queries must return semantically equivalent results, or a faster result may simply reflect fewer rows or a different null rule. Separate storage-read throughput from application response latency and include the client network path when that path is part of the service objective. Execute enough repetitions to characterize distribution rather than quoting the fastest run; document timeouts and failures instead of silently dropping them. To compare schemas, change one controlled factor at a time and retain the same raw input.
To measure a 10-fold change honestly, fix the query's semantics before considering elapsed time. Record server build, CPU model, core count, memory capacity, filesystem or object store, replication, number of active parts, mark granularity, column codecs and data generator seed. A result using cached compact columnar blocks cannot be compared unqualified with one scanning an unindexed OLTP table from cold disk. When replaying reports, check results across duplicate keys, NULL values, time-zone boundaries and late updates. Use query IDs for tracing metrics, but avoid disclosing sensitive literals.
Benchmark duration must be long enough to include background merges and cache equilibrium. A one-minute insert spike can report high throughput while silently leaving hours of deferred compaction work. A stable-service measurement therefore records input and output rates, backlog slope, failure count, memory pressure and p95/p99 over a longer period. Report the entire workload distribution and uncertainty intervals instead of choosing only the query for which the intended technology wins most decisively.
34.2. Warm/Cold Caches, Concurrency, and Queueing Delay
Run cold and warmed cases separately and record which caches were reset or retained. Offered concurrency and arrival patterns influence queueing delay even with unchanged query plans. Open-loop generators can reveal overload that closed-loop clients hide through coordinated omission. Include background ingestion and merges when they are present in the intended production workload.
A warm-cache experiment can understate disk or object-store latency, while a cold-cache experiment can understate throughput of a service that legitimately serves repeated queries from memory. Both are useful when clearly labeled. Parallel requests increase aggregate throughput only until a shared resource saturates; after saturation, queueing and memory contention cause p95/p99 to rise. Coordinated omission occurs when a load generator reduces new arrivals while the system is slow and thereby fails to observe delays that real independent arrivals would suffer. Use an open-loop arrival process or correct the measured latency distribution accordingly when the service objective concerns external arrival times.
34.3. p50/p95/p99, Throughput, and Query Correctness
Percentiles describe different parts of the latency distribution and require adequate sample size. Report attempts, successes, errors, timeouts, and response-size distributions. Throughput achieved by returning partial or incorrect results is not equivalent to throughput at the required semantics. Confidence intervals and repeated trials reduce the risk of treating noise as an optimization.
A 30 ms median and 900 ms p99 describe a materially different service from a consistently 50 ms service even when the first has a lower mean under a favorable test. For an analytical API subject to a user-visible latency budget, tail behavior and timeouts may govern usability more strongly than peak single-query speed. Compute distribution statistics from all attempts, including failures, at declared concurrent arrival rates. A p99 estimate is not meaningful without sample count and a consistent definition of which operation boundaries are being timed.
[26] [27]
Queueing effects and stochastic system models are examined in Queueing Theory and Stochastic Processes.
Report p50, p95 and p99 over a defined population of completed and failed operations. A distribution containing long timeouts must not be made artificially fast by omitting those failed requests. Throughput measurements should correspond to completed meaningful analytical results rather than HTTP requests accepted into a queue. A query returning an incorrect aggregate or a partial distributed result is not a successful performance observation. Keep confidence intervals or repeated-run distributions when the observed improvement is small relative to measurement variability.
34.4. Compression, Cost per TB, and Resource Utilization
Compare logical input size, compressed persistent bytes, indexes, replicas, backups, temporary space, and cache capacity. Disk footprint alone is not total cost. A stronger codec can reduce persistent bytes while consuming more CPU or slowing ingestion. Express cost per retained TB and cost per validated query class over a realistic lifetime.
Storage comparisons should account for row count, compression codecs, index metadata, background parts, replicas, materialized views and backups. A twofold compression ratio for one column does not establish that total retained bytes are halved. Include ingest CPU and decompression cost in addition to bytes on disk. A fair price-per-terabyte comparison also declares redundancy, availability zone count, storage class, expected read traffic and retention period. Distinguish logical source bytes, actual engine-allocated bytes and billable replicated bytes in every cost table.
34.5. CPU, Disk I/O, Network, and Memory Bottlenecks
Use CPU time, read/write bandwidth, network bytes, peak RSS, and queueing metrics to identify the critical resource. A faster hash table may lower CPU while leaving storage unchanged; better pruning may reduce bytes read without changing expression cost. Explain improvements through actual resource deltas rather than simply quoting a latency ratio.
CPU saturation, memory bandwidth, random disk I/O, sequential throughput and network shuffle are distinct potential ceilings. A high CPU percentage does not by itself prove that query arithmetic is the bottleneck: decompression, hash probing, memory allocation and serialization can consume cycles. Conversely, moderate CPU utilization can coexist with severe memory stalls or blocked network reads. Use a combination of selected granules, bytes read, peak memory, query pipeline, system counters and storage metrics to identify the limiting phase. Increasing thread count without examining the resource ceiling may degrade both tail latency and throughput.
34.6. Ingestion versus Query-Speed Trade-Offs
More projections, views, and indexes may accelerate SELECT while increasing insertion, merge, and storage cost. Evaluate continuous ingestion under representative concurrency and the rate at which new parts accumulate. Optimization must satisfy the combined read/write service objectives. An improvement that causes unbounded merge backlog is not a sustainable gain.
An index or projection that accelerates SELECT may increase bytes written per INSERT and deferred merge CPU. Under continuous ingestion, the cost is paid even when the corresponding query is rarely executed. Define a benefit model that weights query frequencies and saved latency against maintenance cost, write amplification and recovery complexity. If a service demands both peak ingest throughput and low-latency interactive reporting, isolate workload classes or use appropriately staged precomputation rather than assuming a single global configuration can optimize every operation. Evaluate write-side overhead under concurrent analytic load rather than under isolated bulk insertion alone.
34.7. TCO, Licensing, Cloud versus On-Premises, and Disaster Recovery
Total cost includes compute, storage, replication, backups, transfer, licensing, staffing, monitoring, and recovery. Open-source licensing removes some fees but does not make operations free. Managed services may change staffing and elasticity costs while introducing provider-specific limits. Compare equivalent resilience, data freshness, query correctness, and retention requirements.
Total cost of ownership includes compute, durable replicas, backups, network transfer, human operations, incident response and migration engineering, not only subscription or license fees. A no-license-fee self-hosted product may still require more operational labor or redundant hardware than a managed alternative. Account for both steady-state and recovery provisioning: spare capacity that can restore the service within its RTO is part of the true cost. Compare systems at equivalent query outputs, retention, freshness, resilience and p99 objectives. Vendor-declared percentage savings should remain attributed to the vendor's own assumptions and test harness.
34.8. A/B Schema Comparisons and Interpretation
Change one physical design factor at a time when determining causality: sorting prefix, partition expression, codec, or summary view. Randomize or alternate run order to reduce thermal and cache drift; measure multiple trials. Explain regressions as carefully as improvements. Include ingestion and storage consequences so the result applies to the whole workload rather than one favored query.
In an A/B comparison, use identical source rows, logical predicates, projection lists, and correctness tolerances. Record both the SELECT speedup and the extra resources consumed during INSERT and part merging. If a projection reduces p95 query latency by 40% but doubles ingestion CPU and increases merger backlog, the overall workload may be less reliable. This is especially relevant when changing sorting keys for a currently successful production ingestion pattern.
[41] [26] [27] [47] [48]
An A/B comparison between two sorting keys must use the same events and representative query distributions. Report a vector of outcomes rather than one headline: selected marks, read bytes, median and tail latency, insertion rate, peak memory, merge debt and compressed storage. If variant A is 30% faster on selective time-window queries but doubles merge backlog and worsens global aggregation, its suitability depends on workload weights. Warm-up both alternatives consistently and include repeated randomized query order to reduce cache bias. For statistical comparisons, report sample count and uncertainty around the observed difference rather than inferring causality from one run.
A controlled comparison can be formulated as a multi-objective experiment rather than one headline SELECT latency. Begin with a common source table and generate two variants that differ in exactly one tested design variable—such as (tenant_id, service_id, event_time) versus (event_time, service_id) for the same events. Record the sorting key, partition key, index granularity, codecs, projections, and inserted part distribution for both. Execute the same query population in randomized order while keeping concurrency, caches and server settings comparable. For each query class record correct output hashes, selected marks, compressed bytes read, median latency, p95/p99 latency, peak memory and spill bytes. For ingestion record committed events/s, bytes written, part creation and sustained merge backlog.
Suppose variant A answers organization-filtered time-window queries 30% faster but increases part generation or global aggregation cost under concurrent ingestion. A weighted objective can use Σᵢ wᵢ·latencyᵢ, but operational constraints such as p99 ≤ target, backlog growth ≤ 0 and replica recovery time ≤ RTO must still be satisfied separately. Do not allow a large gain in a rare query to conceal a failure of a strict service objective. A test whose fastest result is used as the single comparison may reward a lucky cache state; retain the full distribution and failure observations.
For a price comparison, normalize billed compute, retained replicated storage, backup, transfer, operational labor and acceptable service level. A comparison involving ClickHouse and PostgreSQL must not assume that the systems perform identical mutations or provide the same transaction guarantees. Likewise ClickHouse-versus-Elasticsearch full-text retrieval must explicitly match tokenization and relevance semantics before treating results as the same task. Published vendor benchmarks are evidence of what happened under those measurements, not a predictive coefficient for all organizations. Reproduce the closest workload locally and report sensitivity to data volume, selectivity, number of active parts, and concurrency.
34.9. Analytical Migration Decisions and Effects on the Source
An Oracle-to-ClickHouse migration is successful only if source OLTP latency remains within objectives, analytical queries meet accuracy/freshness requirements, and the combined operating cost is acceptable. Measure source CPU and I/O before and after moving reads, including CDC overhead and snapshot cost. Maintain a reversible rollout with reconciliation at documented watermarks. Fast aggregate queries cannot compensate for missing transactions or an unrecoverable analytical copy.
A migration decision should define quantitative acceptance criteria for source OLTP safety, target analytical correctness, p95/p99 latency, ingestion freshness, restore capability and full lifetime cost. The operational source remains authoritative until a separate business decision changes that contract. A parallel run is useful: execute identical report definitions against the source and ClickHouse at matched source commit boundaries, reconcile discrepancies, and examine late updates or deletes. The cutover can then route selected analytic queries without forcing transactional updates into a storage engine optimized for different workloads. Rollback must preserve a supported reporting path and enough retained CDC data to rebuild failed intervals. A vendor's best-case benchmark supports exploration but cannot substitute for deployment-specific validation.
References
- Boncz, P.; Zukowski, M.; Nes, N. (2005). MonetDB/X100: Hyper-Pipelining Query Execution. CIDR, 225–237. https://www.cidrdb.org/cidr2005/papers/P19.pdf
- Brown, A. (2026). What is chDB? In-process ClickHouse for Python. ClickHouse Engineering, 8 June 2026. https://clickhouse.com/resources/engineering/what-is-chdb
- Chaudhuri, S.; Dayal, U. (1997). An Overview of Data Warehousing and OLAP Technology. ACM SIGMOD Record, 26(1), 65–74. https://doi.org/10.1145/248603.248616
- ClickHouse. Announcing General Availability of ClickHouse Full-text Search. 10 March 2026. https://clickhouse.com/blog/full-text-search-ga-release
- ClickHouse. Backup and Restore. https://clickhouse.com/docs/operations/backup
- ClickHouse. Choosing a Primary Key. https://clickhouse.com/docs/best-practices/choosing-a-primary-key
- ClickHouse (2023). Choosing the Right Join Algorithm. https://clickhouse.com/blog/clickhouse-fully-supports-joins-how-to-choose-the-right-algorithm-part5
- ClickHouse. ClickBench: A Benchmark for Analytical DBMS. https://benchmark.clickhouse.com/
- ClickHouse. ClickHouse and PostgreSQL: Performance Comparison. https://clickhouse.com/comparison/postgresql
- ClickHouse (2026). ClickHouse Concurrency: How to Size for User-facing Analytics. https://clickhouse.com/resources/engineering/high-concurrency-sizing-user-analytics
- ClickHouse (2026). ClickHouse Projections Now Behave Like True Secondary Indexes. https://clickhouse.com/blog/projections-secondary-indices
- ClickHouse (2026). ClickHouse release 26.8 — Background Queries, Pipelined SQL, User Query Log, Distributed Optimizations. 10 September 2026. https://clickhouse.com/blog/clickHouse-release-26-08
- ClickHouse. CostBench: An Open Data Warehouse Cost-Performance Benchmark. https://clickhouse.com/benchmarks/costbench
- ClickHouse. Feature Journey: Indexing, Query Planning and Updates. https://clickhouse.com/clickhouse/feature-journey
- ClickHouse. Introduction to ClickHouse; Architecture and Core Concepts. https://clickhouse.com/docs/introduction-clickhouse
- ClickHouse. Materialized Views and Projections. https://clickhouse.com/docs/materialized-views ; https://clickhouse.com/docs/data-modeling/projections
- ClickHouse. MergeTree Table Engine Family. https://clickhouse.com/docs/engines/table-engines/mergetree-family/mergetree
- ClickHouse. Monitoring Asynchronous Inserts. https://clickhouse.com/blog/monitoring-asynchronous-data-inserts-in-clickhouse
- ClickHouse (2026). Official ClickHouse Packages — Stable and LTS Release Channels. Accessed 27 October 2026. https://packages.clickhouse.com/
- ClickHouse. Parts and Partitions. https://clickhouse.com/docs/parts ; https://clickhouse.com/docs/partitions
- ClickHouse. Performance and Query Optimization. https://clickhouse.com/docs/optimize/query-optimization
- ClickHouse (2025). Release 25.7: Lightweight Updates and Deletes with Patch Parts. https://clickhouse.com/blog/clickhouse-release-25-07
- ClickHouse (2026). Release 26.1: Deduplication of Asynchronous Inserts with Materialized Views. https://clickhouse.com/blog/clickhouse-release-26-01
- ClickHouse (2026). Release 26.3: Asynchronous Inserts by Default. https://clickhouse.com/blog/clickhouse-release-26-03
- ClickHouse (2026). Release 26.9: Incremental Refreshes, DISTINCT Disk Spilling, Scoped Tokens and Conditional LIMIT. 23 September 2026. https://clickhouse.com/blog/clickhouse-release-26-09
- ClickHouse. Security, Users, Roles and Access Control. https://clickhouse.com/docs/operations/access-rights
- ClickHouse. System Tables and a Window into the Internals of ClickHouse. https://clickhouse.com/blog/clickhouse-debugging-issues-with-system-tables
- ClickHouse. System Tables and Query Logging. https://clickhouse.com/docs/operations/system-tables/query_log
- ClickHouse (2026). The Definitive Guide to ClickHouse Query Optimization. https://clickhouse.com/resources/engineering/clickhouse-query-optimisation-definitive-guide
- ClickHouse. Update and Delete Operations. https://clickhouse.com/docs/managing-data/update_mutations ; https://clickhouse.com/docs/managing-data/delete_mutations
- ClickHouse (2026). When to Denormalize, When to Join. https://clickhouse.com/resources/engineering/when-to-denormalize-when-to-join
- ClickHouse. When to Use OPTIMIZE TABLE FINAL in ClickHouse. 15 June 2026. https://clickhouse.com/resources/engineering/clickhouse-optimize-table-final
- Debezium. Oracle Connector Documentation. https://debezium.io/documentation/reference/connectors/oracle.html
- Dolan, Y. (2026). Top 10 Best Practices Tips for ClickHouse. ClickHouse, 26 March 2026. https://clickhouse.com/blog/10-best-practice-tips
- Elasticsearch. The Elasticsearch Distributed Search and Analytics Engine. https://www.elastic.co/docs
- Gray, J.; Chaudhuri, S.; Bosworth, A.; Layman, A.; Reichart, D.; Venkatrao, M.; Pellow, F.; Pirahesh, H. (1997). Data Cube: A Relational Aggregation Operator Generalizing Group-By, Cross-Tab, and Sub-Totals. Data Mining and Knowledge Discovery, 1, 29–53. https://research.ibm.com/publications/data-cube-a-relational-aggregation-operator-generalizing-group-by-cross-tab-and-sub-totals
- Melnik, S.; Gubarev, A.; Long, J. J.; Romer, G.; Shivakumar, S.; Tolton, M.; Vassilakis, T. (2010). Dremel: Interactive Analysis of Web-Scale Datasets. Proceedings of the VLDB Endowment, 3(1), 330–339. https://doi.org/10.14778/1920841.1920886
- Milovidov, A. (2025). ClickHouse Release 25.9: Vector Index and ANN Search. Official release presentation. https://presentations.clickhouse.com/2025-release-25.9/
- Milovidov, A. (2026). ClickHouse Release 26.10. Official release presentation, 22 October 2026. https://presentations.clickhouse.com/2026-release-26.10/
- Oracle. Oracle Database: Concepts, Redo and LogMiner. https://docs.oracle.com/en/database/oracle/oracle-database/
- Schreiber, T. (2024). ClickHouse vs. Elasticsearch: The Billion-Row Matchup. ClickHouse Engineering, 7 May 2024. https://clickhouse.com/blog/clickhouse_vs_elasticsearch_the_billion_row_matchup
- Schreiber, T. (2025). How We Made ClickHouse UPDATEs 1,000× Faster (Part 3: Benchmarks). ClickHouse Engineering, 7 August 2025. https://clickhouse.com/blog/updates-in-clickhouse-3-benchmarks
- Schreiber, T. (2026). How ClickHouse Became Fast at Joins. ClickHouse, 3 June 2026. https://clickhouse.com/blog/clickhouse-fast-joins
- Schreiber, T.; Palacin, L. (2026). CostBench: Putting Real-Time Analytics to the Test. ClickHouse, 8 September 2026. https://clickhouse.com/blog/costbench-real-time-performance-per-dollar
- Schreiber, T.; Palacin, L. (2026). Do you still need Elasticsearch for log analytics? ClickHouse says no. ClickHouse Engineering, 23 April 2026. https://clickhouse.com/blog/elasticsearch-log-analytics-clickhouse
- Schulze, R.; Schreiber, T.; Yatsishin, I.; Dahimene, R.; Milovidov, A. (2024). ClickHouse — Lightning Fast Analytics for Everyone. Proceedings of the VLDB Endowment, 17(12), 3731–3744. https://doi.org/10.14778/3685800.3685802
- Stonebraker, M.; Abadi, D. J.; Batkin, A.; Chen, X.; Cherniack, M.; Ferreira, M.; Lau, E.; Lin, A.; Madden, S.; O'Neil, E. J.; O'Neil, P. E.; Rasin, A.; Tran, N.; Zdonik, S. B. (2005). C-Store: A Column-oriented DBMS. Proceedings of VLDB, 553–564. https://dblp.org/rec/conf/vldb/StonebrakerABCCFLLMOORTZ05.html
- Wheeler, D. (2026). pg_clickhouse is the Fastest Postgres Extension on ClickBench. ClickHouse. https://clickhouse.com/blog/pg_clickhouse-fastest-analytics-for-postgres